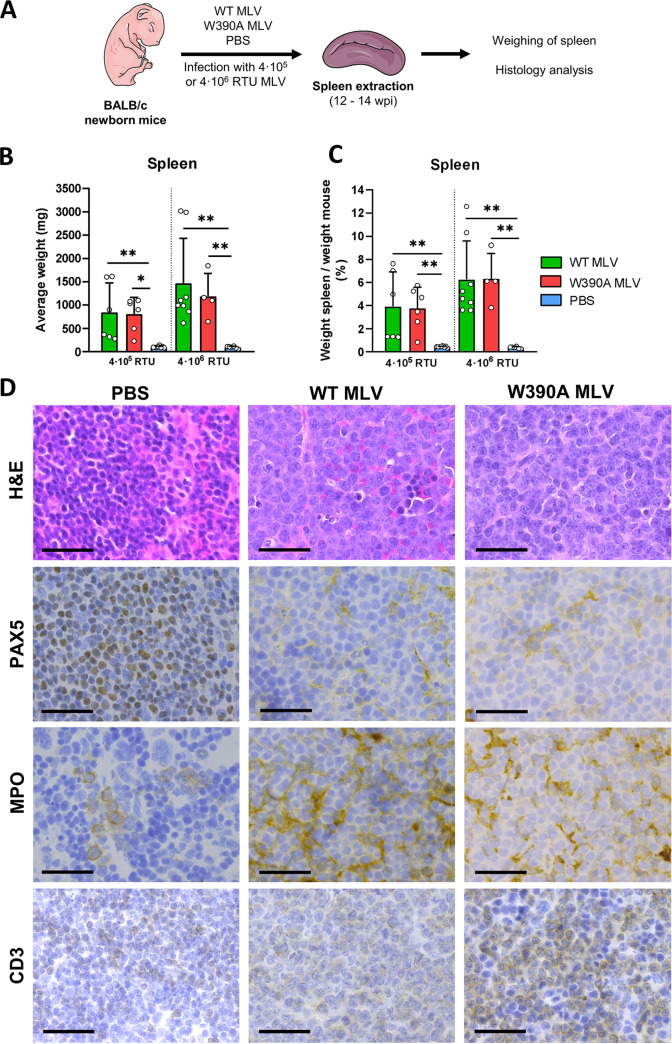
FIG 4.
Spleen pathology in WT MLV- and W390A MLV-infected mice. (A) Schematic representation of the workflow to analyze the pathology in spleens from WT MLV- and W390A MLV-infected mice. Spleens were sampled between 80 and 90 days after infection. (B) Average weight of the spleens of mice infected with 4 × 10⁶ RTU of WT MLV (4 × 10⁵ RTU, n = 6; 4 × 10⁶ RTU, n = 9) or W390A MLV (4 × 10⁵ RTU, n = 6; 4 × 10⁶ RTU, n = 4) or injected with PBS (n = 8 and 6 for comparisons with 4 × 10⁵ RTU and 4 × 10⁶ RTU, respectively) as negative controls. Bars show means ± SD, while dots represent individual values. Statistically significant differences were analyzed using a Kruskal-Wallis test. (C) Percentage of the weight of the spleen in relation to the body mass of mice infected with WT MLV (4 × 10⁵ RTU, n = 6; 4 × 10⁶ RTU, n = 9) or W390A MLV (4 × 10⁵ RTU, n = 6; 4 × 10⁶ RTU, n = 4) or injected with PBS (n = 8 and 6 for comparisons with 4 × 10⁵ RTU and 4 × 10⁶ RTU, respectively). Bars show means ± SD, while dots represent individual values. Statistics were done using the Kruskal-Wallis test. (D) H&E, PAX-5, MPO, and CD3 staining of histological sections of spleens. Mice were infected with 4 × 10⁶ RTU of WT MLV or W390A MLV or injected with PBS as described above. Representative images are shown. Black arrows point to mitotic figures. PBS was used as a negative control. Bars, 20 μm.

