FIG 5.
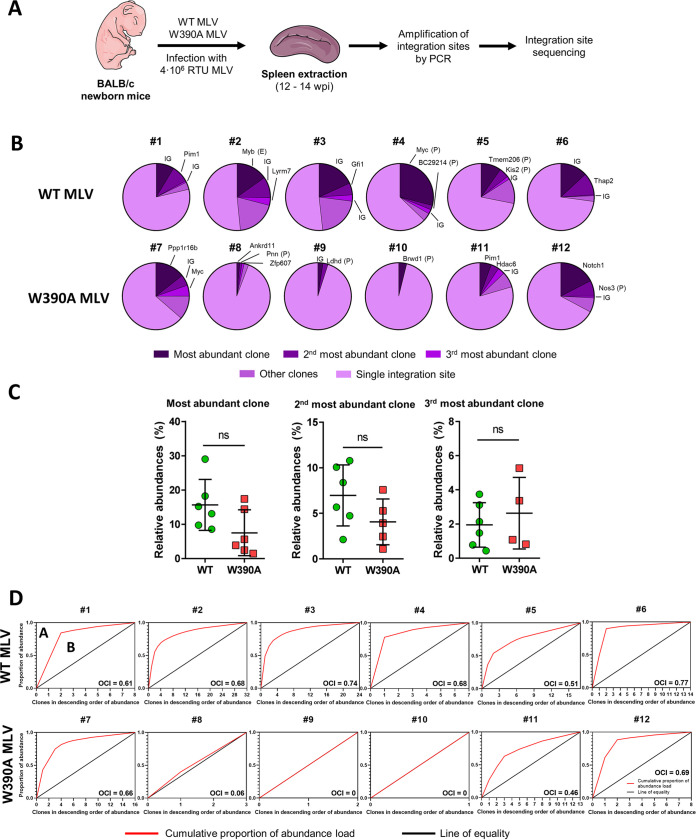
Clonal expansion of tumor cells in the spleen induced by WT MLV or W390A MLV. (A) Schematic representation of the workflow to determine the integration site selection of WT MLV and MLV W90A in mouse tumor cells at 12 to 14 weeks postinfection. (B) Pie charts representing the relative abundances of clones and single integration sites. Each pie chart corresponds to a single mouse infected with WT MLV or W390 MLV. Intergenic site (IG), gene, enhancer (E), or promoter (P) names indicate the MLV integration sites of the three most dominant clones in each mouse. (C) Relative abundances of the top three integration sites in mice infected with WT MLV or W390A MLV. No statistically significant difference was found using a Mann-Whitney test. (D) Cumulative fraction of MLV clones from WT MLV- or W390A MLV-infected mice. The oligoclonality index (OCI) was calculated as OCI = A/(A + B).

