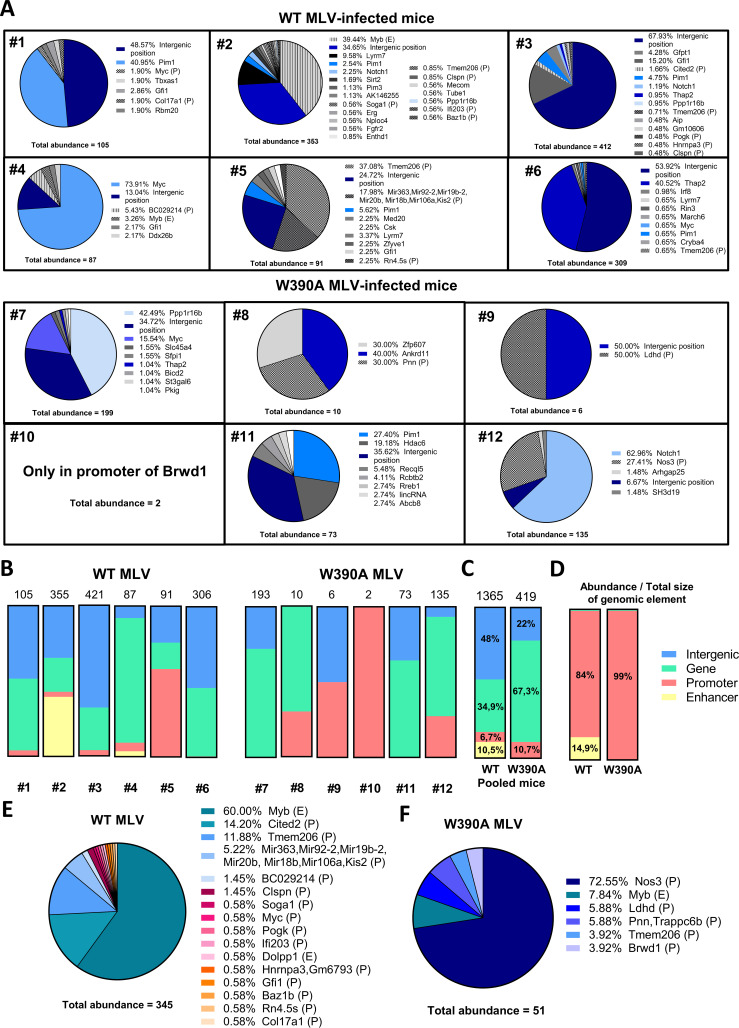
FIG 6.
Distribution of MLV abundances in clones generated by WT MLV or W390A MLV insertion. (A) Pie charts depicting individual gene insertional profiles of splenic cells with clonal expansion from mice infected with 4 × 10⁶ RTU of either WT MLV or W390A MLV. The total abundance determined by NGS analysis is shown below each pie chart for both MLV constructs. The percentage before each gene name indicates the relative abundance of that gene. Genes with insertions of both WT MLV and W390A MLV are colored on a blue scale. (B) MLV abundances in intergenic positions (blue), gene bodies (green), promoters (red), and enhancers (yellow) in WT MLV- and W390A MLV-infected mice. The numeric mouse identifier is indicated below each bar. The total abundance of clonal integration sites in each mouse is indicated on top of the bar. (C) Pooled MLV abundances from intergenic positions (blue), gene bodies (green), promoters (red), and enhancers (yellow) in WT MLV (n = 6)- and W390A MLV (n = 6)-infected mice. The total abundance of pooled clonal integration sites from mice infected with either WT MLV or W390A MLV is indicated on top of the bar. The distribution of integration sites between WT MLV and W390A MLV was analyzed using a chi-squared test. The test reported a statistically significant difference between both distributions (P ≤ 0.0001). (D) MLV abundances from intergenic positions (blue), gene bodies (green), promoters (red), and enhancers (yellow) normalized by the total genomic size of each genomic feature. Data were normalized by dividing the percent integration site preference for each genomic feature by its own estimated total genomic size: intergenic positions (58.97%), genes (40.54%), promoters (0.05%), and enhancers (0.44%). Data represent results for six mice infected with WT MLV or W390A MLV. (E and F) Abundances in enhancer (E) or promoter (P) elements in spleen cells from mice infected with 4 × 10⁶ RTU of either WT MLV (n = 6) or W390A MLV (n = 6) isolated at 12 to 14 weeks postinfection. The total abundances of integration at enhancer and promoter sites are shown below each pie chart for both MLV constructs. The percentage before each gene name indicates the relative abundance of that gene. Integration into an enhancer or promoter element is indicated by E or P, respectively.

