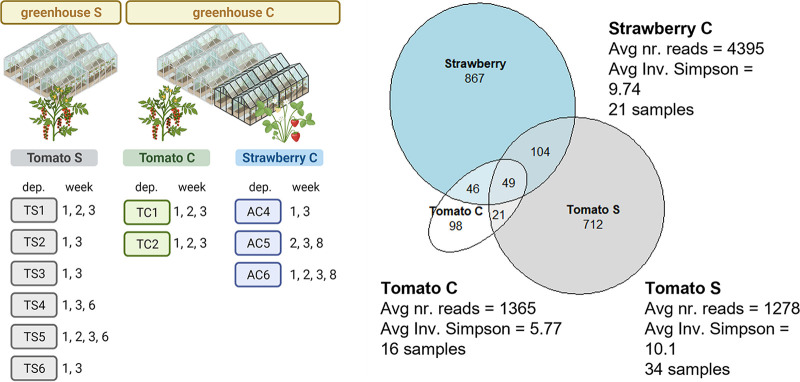
FIG 1.
(A) Sampling setup. Samples from tomato and strawberry plants were taken from two greenhouses, subdivided into departments. One to three samples were taken per department and per time point (weeks 1, 2, 3, 6, and 8). (B) Venn diagram showing the number of different amplicon sequence variants (ASVs) found in three groups: tomato plants from greenhouses C and S as well as strawberry plants from greenhouse C. The average number of reads, average inverse Simpson index, and number of samples are also indicated in the figure. ASVs were considered present in a sample if more than one read was present.

