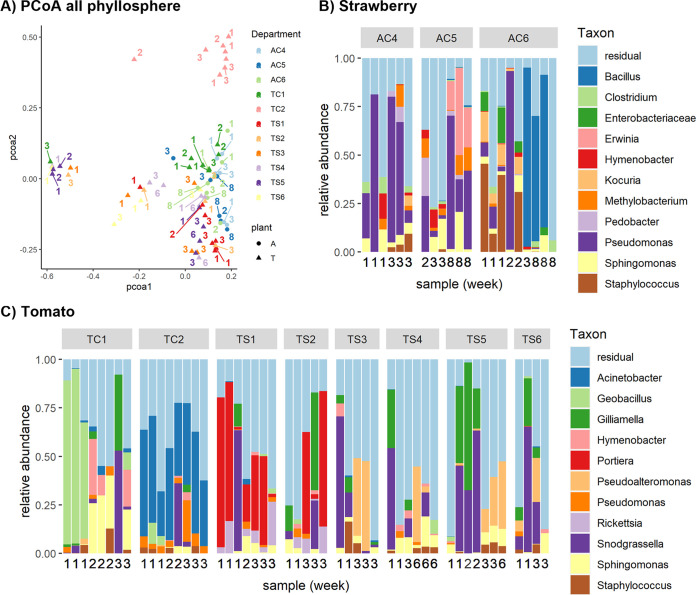
FIG 2.
Phyllosphere microbiome of strawberry and tomato plants. (A) PCoA plot visualizing the variation in the bacterial community composition of phyllosphere samples in a two-dimensional space based on the Bray-Curtis dissimilarity. Strawberry samples are indicated by circles and department codes starting with “A,” while tomato samples are indicated by triangles and department codes starts with “T”. Samples are colored by department, and sampling week is indicated by the number next to each symbol. (B and C) Barplots showing the 11 most abundant genera for each phyllosphere sample (strawberry in [B] and tomato in [C]). Samples are divided by department, and the sampling week is indicated by a number underneath each bar.

