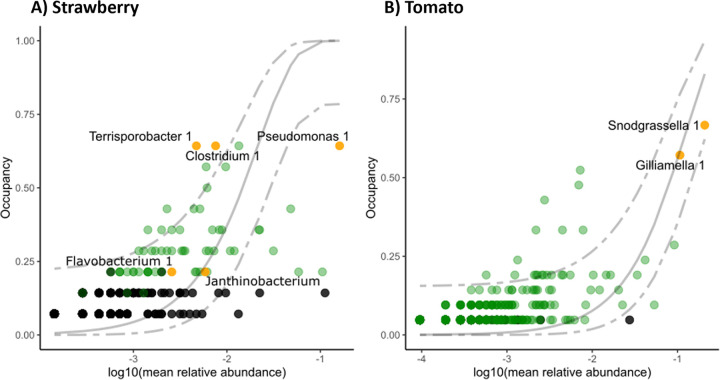
FIG 3.
Occupancy-abundance curves for the strawberry (A) and tomato samples (B). For each ASV, occupancy (proportion of plant samples in which an ASV was present) was plotted against the log10 transformation of its mean relative abundance in these plant samples. ASVs that were identified as core taxa based on the ‘elbow’ method are highlighted in yellow, and their annotations are added (30). ASVs identifed as core taxa by the less stringent ‘lastcall’ method are highlighted in green. Other ASVs are shown in black. A neutral model was fitted on the occupancy-abundance curves (solid gray line shows the model fit, and dashed lines show the 95% confidence interval).

