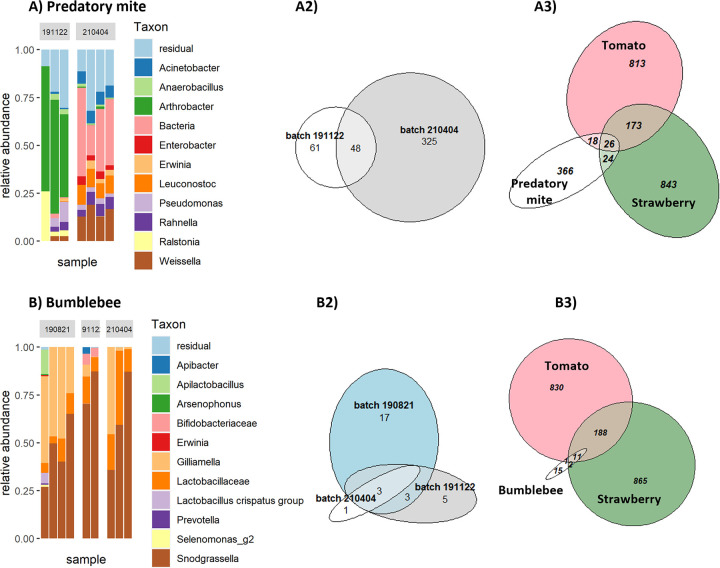
FIG 4.
Contact microbiome of different batches of predatory mites (A) and bumblebees (B). (1) Barplots showing the 11 most abundant genera for predatory mite (A) and bumblebee samples (B). Samples are grouped per batch, which were ordered at different times from the same company. (2) Venn diagrams showing the number of ASVs overlapping between different batches of predatory mites (A2) and bumblebees (B2). (3) Venn diagrams showing the number of ASVs overlapping between phyllosphere samples from tomato and strawberry, with predatory mites (A3) and bumblebees (B3).

