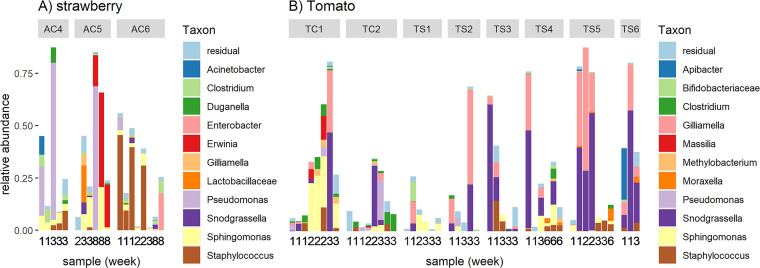
FIG 5.
Relative abundances of invertebrate-associated ASVs in strawberry (A) and tomato (B) samples. The ASVs are aggregated at the genus level, and only the 11 most abundant genera are shown, with the remaining taxa being grouped in ‘residual’. Similarly to Fig. 1C and D, the plant samples are divided by department, and the sampling week is indicated by a number underneath each bar. Two strawberry and two tomato samples did not contain at least two reads of an invertebrate-associated taxon and are not shown in the figure.

