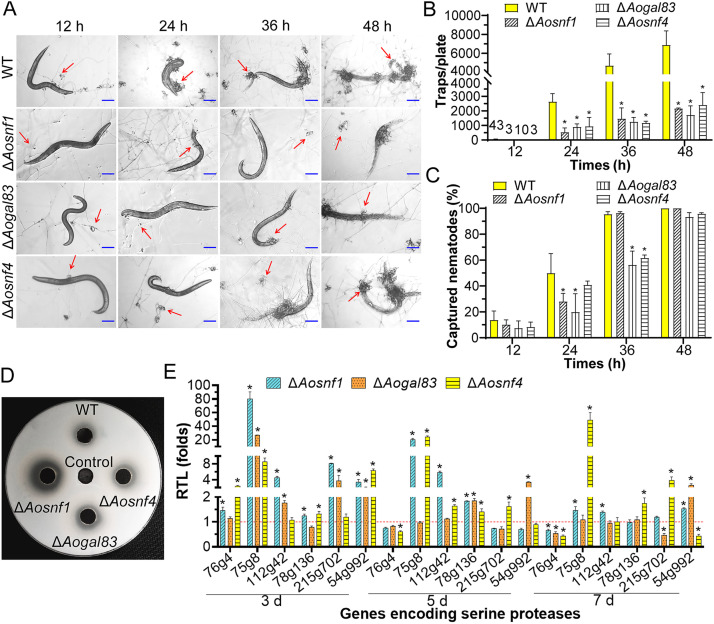
FIG 4.
Trap formation, nematocidal activity, and extracellular proteolytic activity in the WT and mutant strains. (A) Traps induced with nematodes at 12 h, 24 h, 36 h, and 48 h. Red arrows, traps. Scale bar, 100 μm. (B) Comparison of traps produced by the WT and mutant strains at different time points. (C) Percentage of captured nematodes at different time points. (D) Comparison of extracellular protease activity. (E) Relative transcription levels (RTLs) of the genes encoding serine proteases in the WT and mutant strains cultured at different time points. The red line is the standard (RTL = 1) for statistical analysis of the RTL of each gene under a given condition. *, significant difference between the mutant and WT strains (Tukey’s HSD, P < 0.05).

