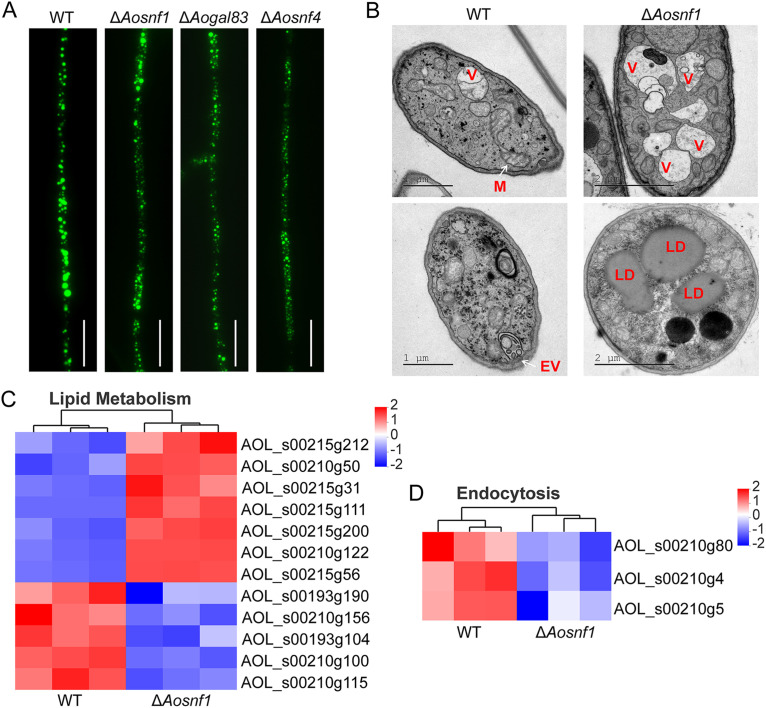
FIG 7.
Lipid metabolism and cellular components in the WT and mutant strains. (A) Lipid droplets (LDs) observed in mycelia of the WT and mutant strains. Scale bar, 10 μm. (B) Cellular components were observed in the WT and ΔAosnf1 mutant strains by transmission electron microscopy. V, vacuole; M, mitochondrion; EV, endocytic vesicle; LD, lipid droplet. (C) Heatmap showing the genes involved in lipid metabolism. (D) Heatmap showing the genes involved in endocytosis. Gene expression patterns are shown on a log10 scale. Red boxes, upregulated clusters; blue boxes, downregulated clusters.

