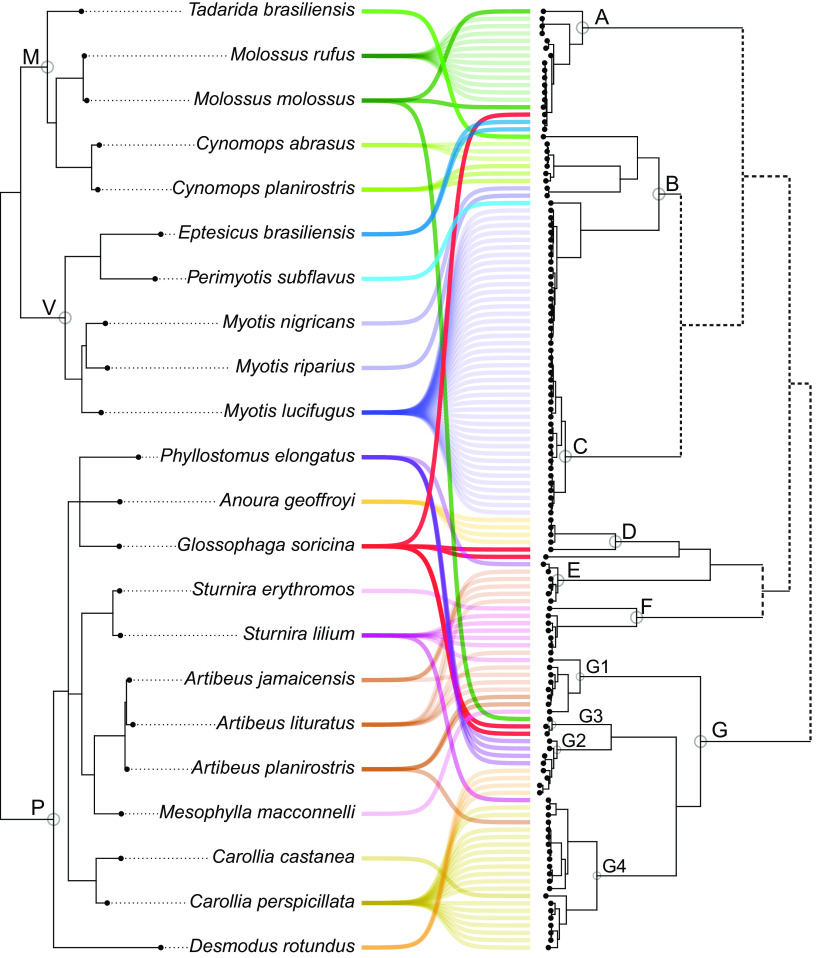
FIG 3.
Cophylogeny plot of bat species phylogeny and alphaCoVs tree. Cyt b-based bat species phylogeny (left) and alphaCoVs phylogeny (right). Gray circles indicate bat families (M, Molossidae; V, Vespertilionidae; P, Phyllostomidae) and main alphaCoV lineages and sublineages (A to G). Bat-CoV links are colored by each bat family. Dotted lines in the alphaCoV phylogeny depict nonsupported clusterings.

