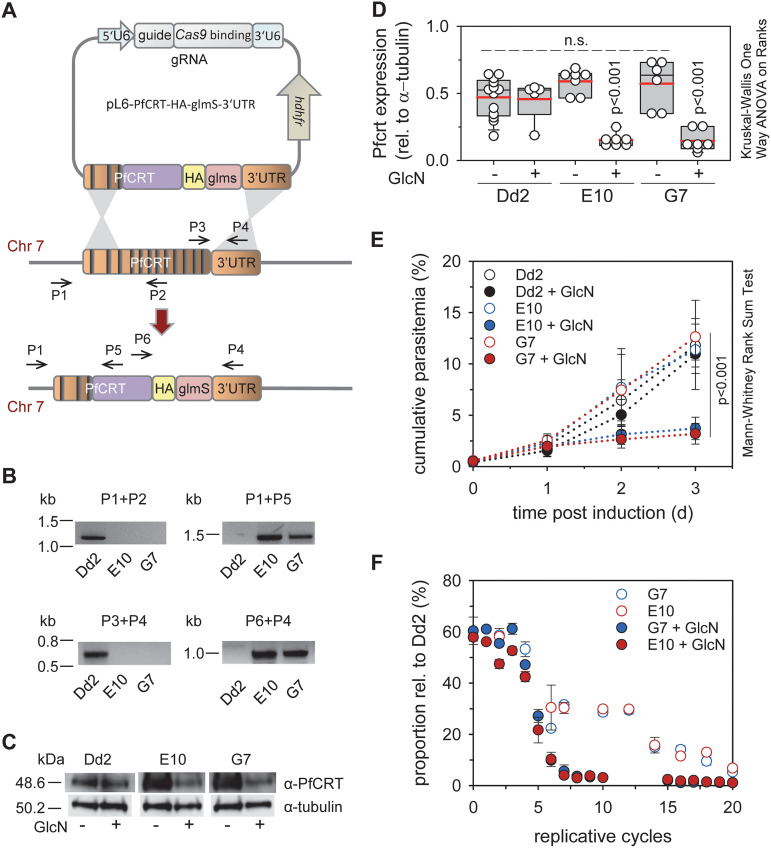
FIG 1.
Generation and analysis of conditional PfCRT knock-down mutants. (A) Cartoon depicting the transfection strategy. The genomic pfcrt locus (dark orange), the recodonized pfcrt fragment (purple), the hemagglutinin tag (HA, yellow) and the glmS ribozyme sequence (pink) are shown. The positions of relevant primers are indicated (Table S10). Introns are represented as vertical black lines. (B) The integration event was verified by PCR, using genomic DNA from the resulting mutants E10 and G7 and the parental Dd2 line. Size markers are indicated in kilo base pairs (kb). (C) Western analysis of total protein derived from trophozoites of Dd2 and the PfCRT knock-down mutants in the presence and absence of glucosamine (1 mM for 3 days), using a guinea pig anti-PfCRT antiserum and as a loading control a mouse monoclonal anti-tubulin antibody and as secondary antibodies a goat anti-guinea pig POD antibody and a donkey anti-mouse POD antibody, respectively. A size standard is indicated in kDa. (D) Independent Western analyses were quantified and PfCRT specific luminescence signals were normalized to those of tubulin. Each symbol represents an independent biological replicate. The statistical test used for data analysis is indicated in this and the following figures in the graph (box plot analysis, see Materials and Methods). (E) Asexual intraerythrocytic proliferation. Proliferation of the conditional pfcrt knock-down mutants, E10 and G7, and the parental strain Dd2 was determined over 72 h in the presence and absence of 1 mM GlcN. Time point 0 indicates the time point at which the cell cultures (the ring stages) were split and one aliquot each was incubated in the presence of GlcN. The other aliquots served as the untreated controls. The cumulative parasitemia is the sum of the parasitemia in the culture after considering splitting and dilution factors. The means ± SEM of four independent experiments are shown. (F) Fitness test. Mixed cultures of Dd2 and each of the PfCRT knock-down mutants were maintained in the presence or absence of 1 mM glucosamine for 20 replicative cycles. The allelic proportions were measured by pyrosequencing. The data represent the means ± SEM of three independent biological replicates.

