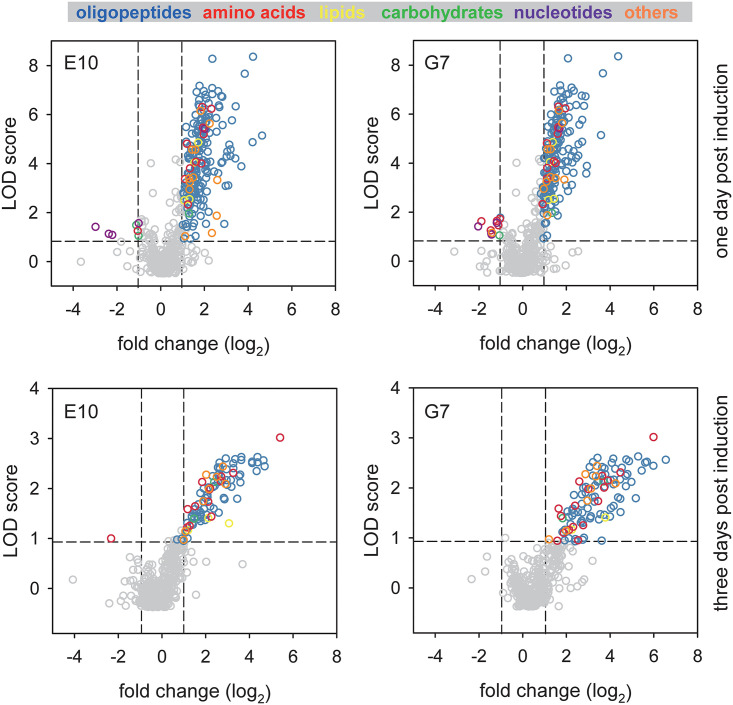
FIG 3.
Comparative global metabolomic profiling of PfCRT knock-down mutants. Volcano plots depict the fold change in metabolites between glucosamine treated (for 1 or 3 days) and untreated PfCRT knock-down mutants E10 and G7. Each dot represents a metabolite. Gray dots indicate metabolites that were not significantly associated with the induced PfCRT knock-down phenotype (P > 0.01, dashed horizontal line, or -1<fold change (log2)<1, dashed vertical lines). Metabolite in the upper left and upper right quadrants indicate metabolites that were significantly down- and upregulated in the glucosamine treated cells, respectively. Colors indicate different metabolite classes.

