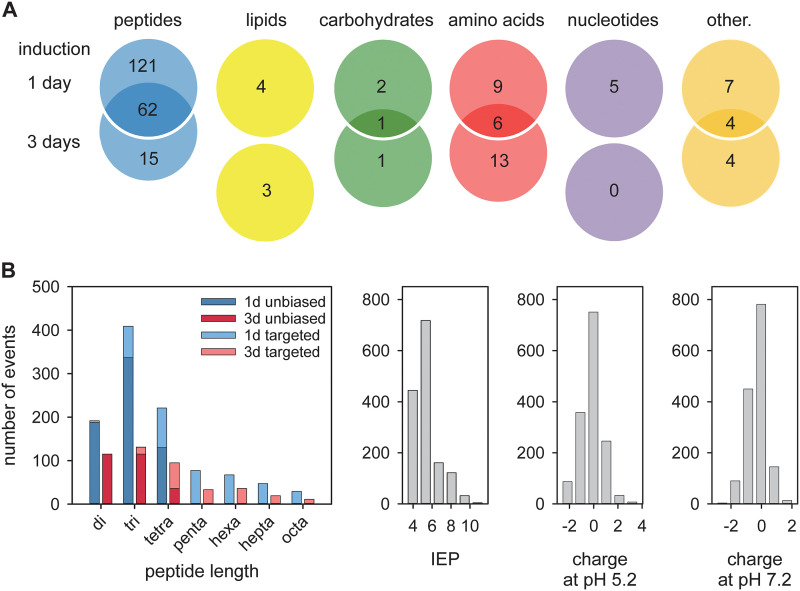
FIG 4.
Analysis of metabolites and oligopeptides associated with the induced PfCRT knock down. (A) Metabolites were categorized, and each category was analyzed using a Venn diagram illustrating the number of metabolites that were distinct and common between the 1- and 3-day glucosamine treated PfCRT knock-down mutants. (B) Analysis of the oligopeptides associated with the induced PfCRT knock-down phenotype according to peptide size (color codes indicate the 1- and 2-day induction regimen and the unbiased and targeted metabolomics approaches), isoelectric point (IEP ranging from 3.27 to 11.49) and charge distribution at pH 5.2 (ranging from -2.70 to 3.73) and 7.2 (ranging from -3.00 to 2.11).

