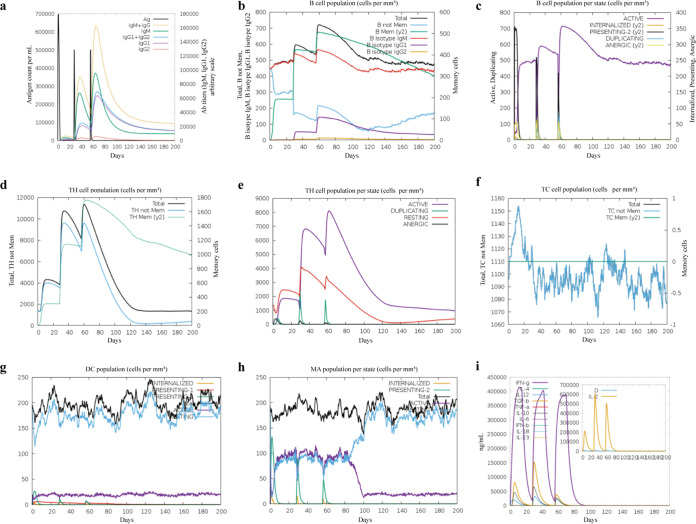
FIG 3.
Immune simulation in silico. (a) Antigen and antibody levels in response to vaccine injection. (b) B-lymphocyte population after three injections of the vaccine. (c) B-lymphocyte population at each stage. (d) T-lymphocyte population after two injections of the vaccine. (e) T-lymphocyte population at each stage. (f) The population of CD8 T-cytotoxic lymphocytes at each state. (g) The population of dendritic cells at each state. The bars in the legend indicate “INTERNALIZED,” “PRESENTING-1,” “PRESENTING-2,” “Total,” “ACTIVE,” and “RESTING,” respectively. (h) Macrophage population at each state. The bars in the legend indicate “INTERNALIZED,” “PRESENTING-2,” “Total,” “ACTIVE,” and “RESTING,” respectively. (i) Concentration of cytokines and interleukins, “D” in the inset plot indicates the danger signal.

