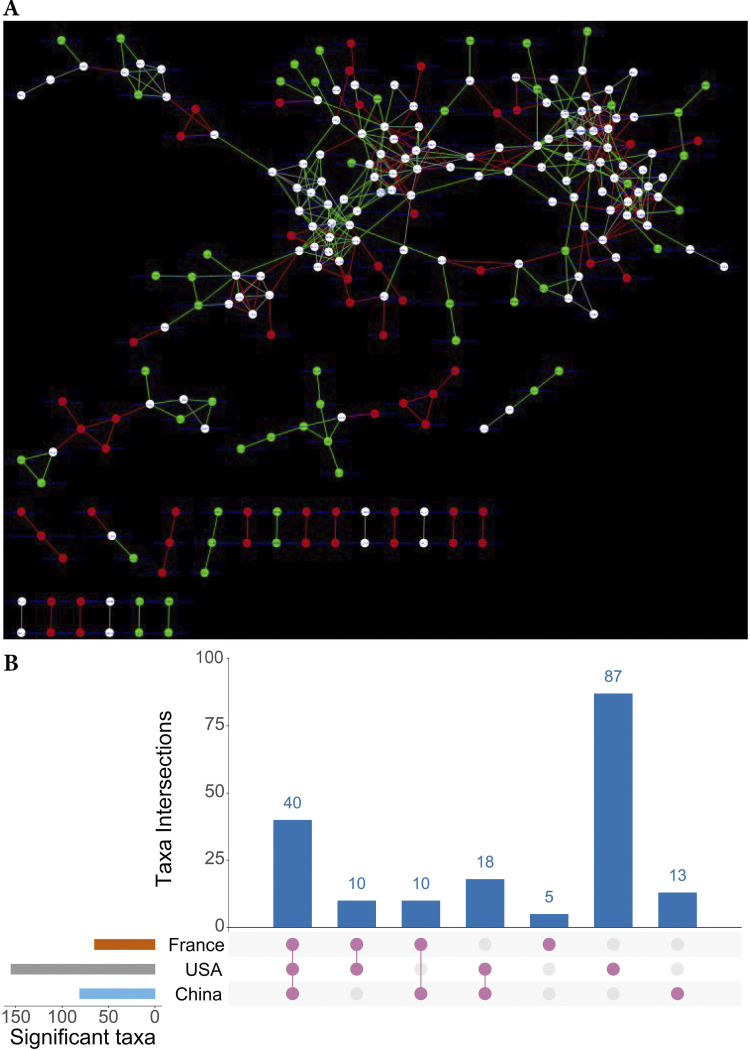
FIG 2.
Co-occurrence networks and DyNet dataset-specific markers. (A) DyNet visualization of synchronized CRC and healthy control co-occurrence networks of microbial species from the China dataset. Red nodes and red edges are present only in the CRC network, green nodes and green edges are present only in the control network, and white nodes are present in both. (B) An Upset plot visualization of DyNet dataset-specific markers intersections across France, USA, and China datasets. Each bar represents the number of dataset markers in that category and orange dots below the bar indicates their conservation across the datasets. For instance, the 1st bar shows 40 Dynet dataset-specific markers that are common in all three datasets.

