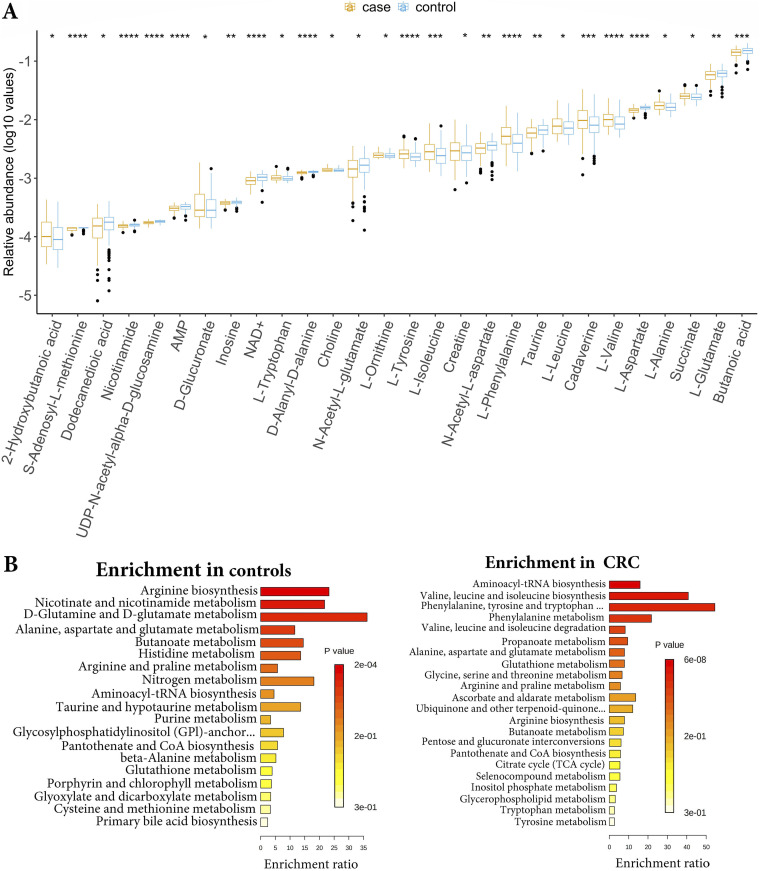
FIG 8.
Analysis of MelonnPan predicted metabolites from the USA, China, and France datasets. (A) The relative abundance of significantly different (P < 0.05) metabolites between CRC and healthy control groups. Blue indicates the control samples and red indicates the CRC samples from all three datasets. Enrichment of pathways based on predicted metabolites in (B) healthy controls and (C) CRC samples.

