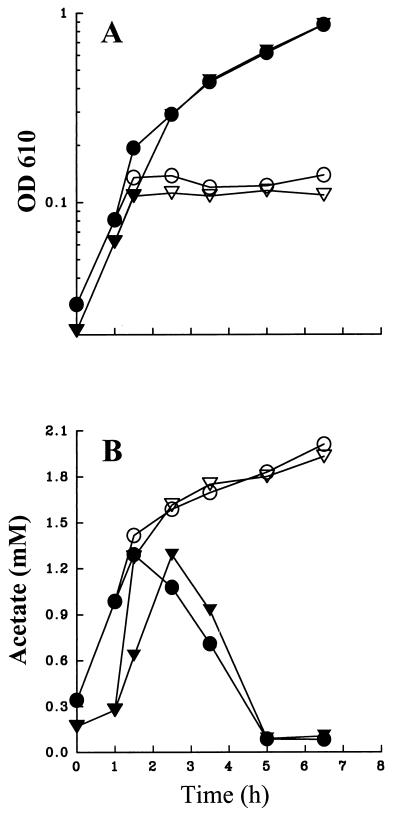
FIG. 1.
OD (A) and extracellular acetate concentration (B) plotted as a function of time for cells of strains UQ285 [rpoD(Ts) rpoS+] and AJW1404 [rpoD(Ts) rpoS::Km] grown at 32°C in TB until the culture reached mid-exponential phase (OD610, ∼0.1), at which point the cultures were divided. Half the culture was further incubated at 32°C (closed symbols) while the other half was incubated at 42°C (open symbols). Circles, strain UQ285; triangles, strain AJW1404. Bars for the standard errors of the mean of triplicate experiments are small relative to the size of the symbols.

