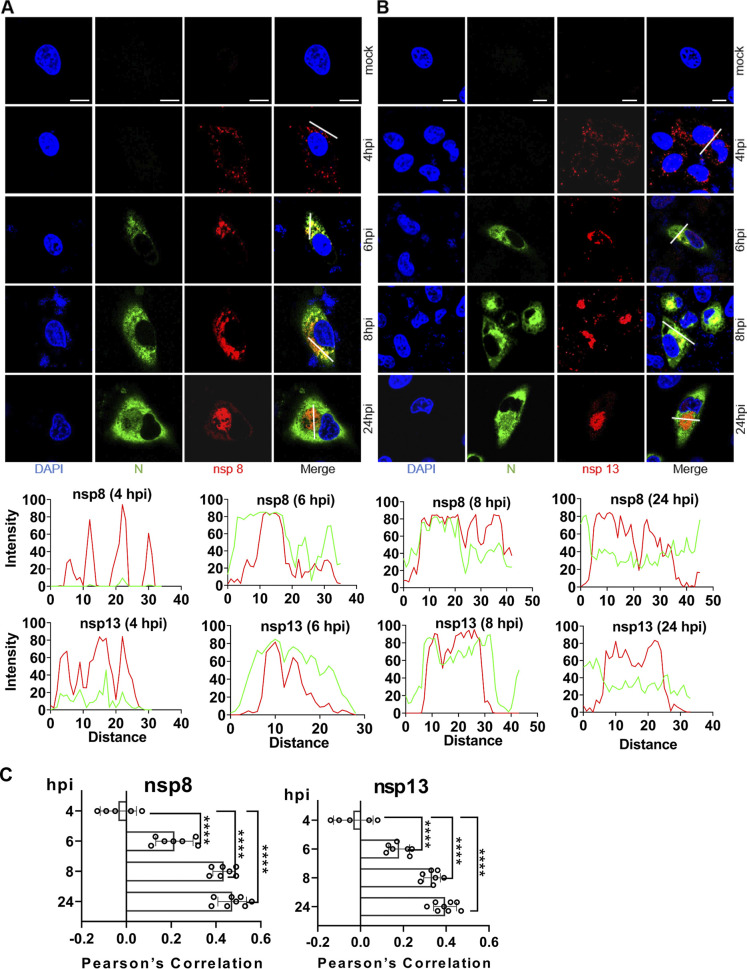
FIG 6.
Time course of nsp8 and nsp13 detection. A549-ACE2 cells were mock infected or infected with SARS-CoV-2 (MOI 2), fixed at 2-, 3-, 4-, 6-, 8-, and 24-h postinfection (hpi), and costained with home-made mouse anti-SARS-CoV-2 N protein serum and rabbit anti-SARS nsp8 (A) or nsp13 (B) polyclonal, followed by staining with goat anti-mouse secondary antibody conjugated with Alexa Fluor 488 (green) and goat anti-rabbit secondary antibody conjugated with Alexa Fluor 555 (red). The cell nuclei were stained with DAPI (blue) and examined by confocal microscopy. No specific signal was observed at 2 and 3 hpi (not shown); scale bars represent 10 μm. The intensity distribution describes the timing of expression of nsp8 or nsp13 for specific fluorescence along the indicated line. (C) Pearson’s correlation was used to analyze changes in nsp8 or nsp13 over time. One-way analysis of variance (ANOVA) was used for multiple comparisons between different times among the nsp8 or nsp13 in GraphPad Prism 8.4.3 software. ****, P < 0.0001.

