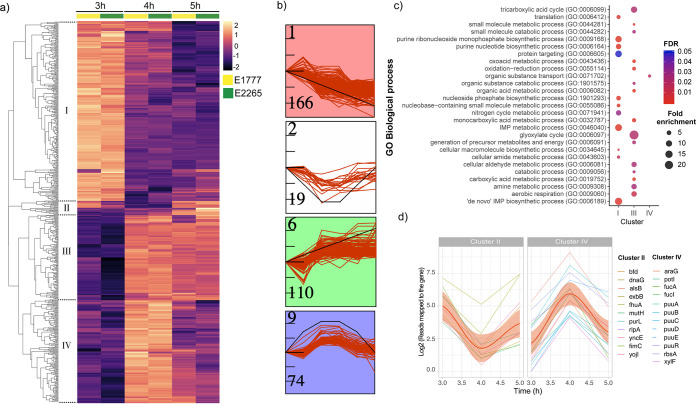
FIG 2.
Transcriptomic response of ETEC during bacterial growth transition from mid-exponential to early stationary phase. (a) Heatmap of the differential expressions of the two strains E1777 and E2265 after 3, 4, and 5 h of growth in LB medium. K-mers analysis indicated four main clusters (I-IV). (b) STEM analysis identifying the most common patterns of gene expression. (c) GO biological process enrichment analysis of significant genes per cluster and fold enrichment. (d) Examples of genes with transient up or downregulation.

