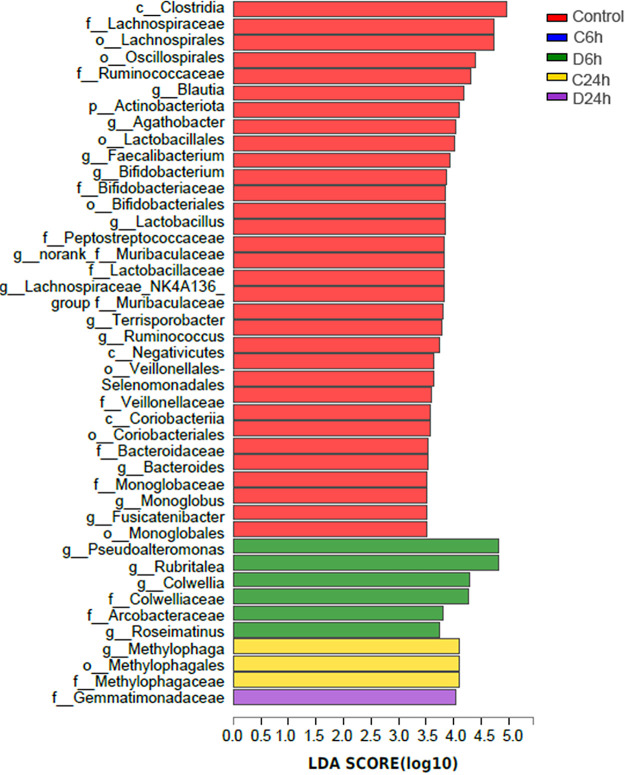
FIG 3.
LEfSe determines the abundance of significant differences in the phylotypes of the gut microbiota among the five groups. The linear discriminant analysis (LDA) score (log10) of each taxon is represented by the horizontal bars, with red, blue, green, yellow, and purple bars indicating taxa enriched in microbiomes from control, C6h, D6h, C24h, and D24h study subjects, respectively.

