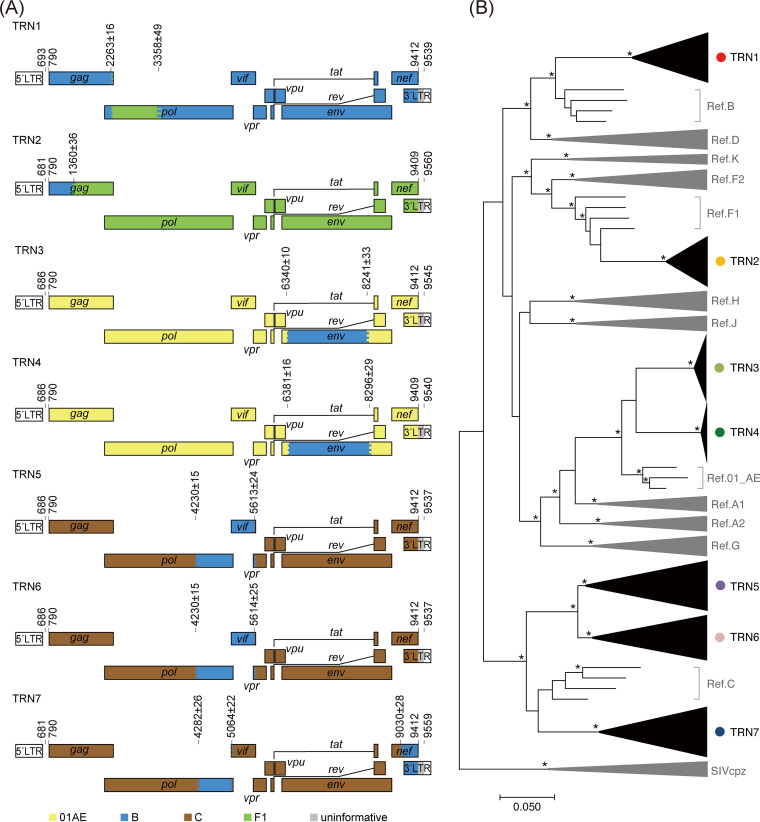
FIG 2.
Characterization of the HIV-1 RFs. (A) Genome maps of the RFs. The numbers on each map denote the nucleotide positions of the breakpoints according to the HXB2 reference numbering system. The colored stripes in the maps indicate the intervals where the recombination breakpoints are estimated to be located. (B) Maximum likelihood tree for pangenomic consensus sequences obtained by nanopore sequencing and complete genomes of the major subtype references. The three sequences of SIVcpz are used as outliers. Branches with bootstrap values (based on 500 replicates) of at least 0.95 are shown with asterisks.

