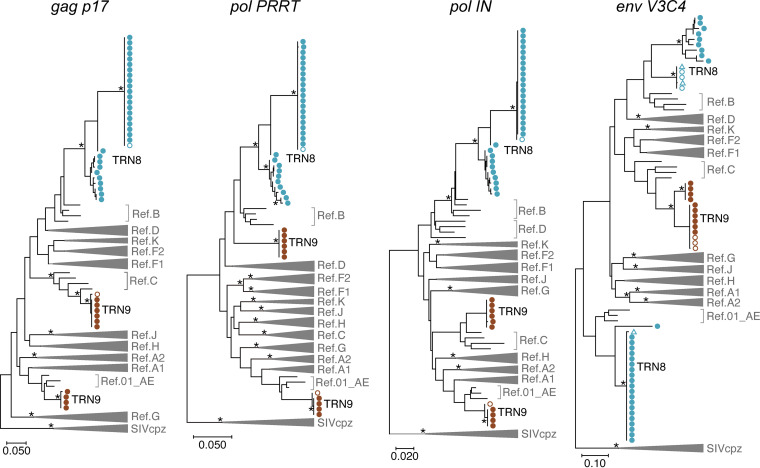
FIG 3.
Phylogenies of consensus sequences determined by nanopore sequencing and Sanger methods. Maximum likelihood trees generated with the GTR model are shown for four regions, gag p17, pol PRRT, pol IN, and env V3C4, with the nucleotide numbers corresponding to those indicated in Fig. 1. The reference sequences of major HIV-1 subtypes (A1, A2, B, C, D, F1, F2, G, H, J, K, and CRF01_AE) and three SIVcpz strains (LB7, MB66, and MB897) are shown in the trees. Branches with bootstrap values (based on 500 replicates) of at least 0.95 are indicated with asterisks. The viral RNA sequences obtained by Sanger sequencing and nanopore sequencing are indicated with open and closed circles, respectively. The proviral DNA sequences generated by Sanger sequencing are shown with triangles.

