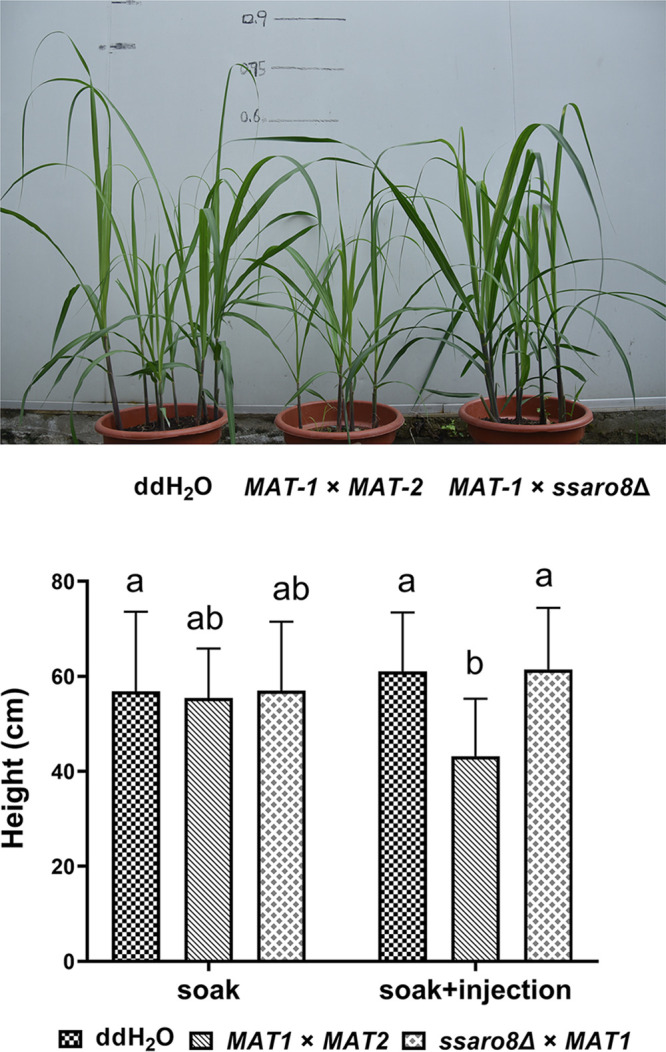
FIG 8.

Pathogenicity assay. Images showing sugarcane seedings infected by MAT-1×MAT-2 or MAT-1×ssaro8Δ mixed sporidia, using soaking plus injection method. ddH2O served as the blank control. Seedling heights were quantified and depicted in the bar chart. Mean ± standard error (SE) was derived from two repeats, each containing approximately 20 seedlings for each treatment. Photographing and seedling height measurement were performed at the 3rd month after sugarcane planting.
