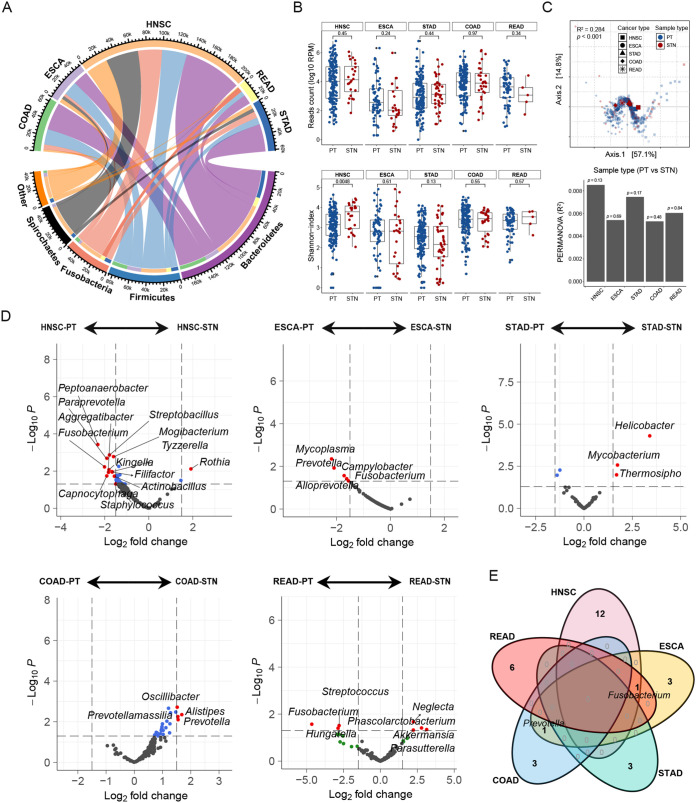
FIG 1.
Distinct microbial diversity and composition exhibit within various cancer types. (A) The distribution of mean bacterial reads counts in head and neck squamous cell carcinoma (HNSC), esophageal carcinoma (ESCA), stomach adenocarcinoma (STAD), rectum adenocarcinoma (READ), and colon adenocarcinoma (COAD) tumor and normal tissues were analyzed. Representative bacteria with high abundance at the phylum level are presented. (B) The differences in the bacterial counts (top) and the alpha diversity (Shannon-index, bottom) were evaluated between primary tumor (PT) and solid tissue normal (STN) tissues. The comparison was performed with the Wilcoxon rank sum test. (C) PCoA was performed after calculating the Bray-Curtis distance based on CLR-transformed data, and the shapes in the scatterplot represent the five cancer types. PERMANOVA was used to calculate the significance of the bacterial beta diversity differences among various cancers (P < 0.001, top), and the difference between the PT and STN tissues in each cancer type was calculated (bottom). (D) Volcano plot showing the differential genera based on the limma test between the PT and STN tissues in each cancer type. A fold change less than zero indicated that the genera were enriched in tumors; otherwise, they were enriched in normal tissues. (E) Venn diagram summarizing the occurrence profile of differentially abundant genera between the PT and STN tissues in various cancers.

