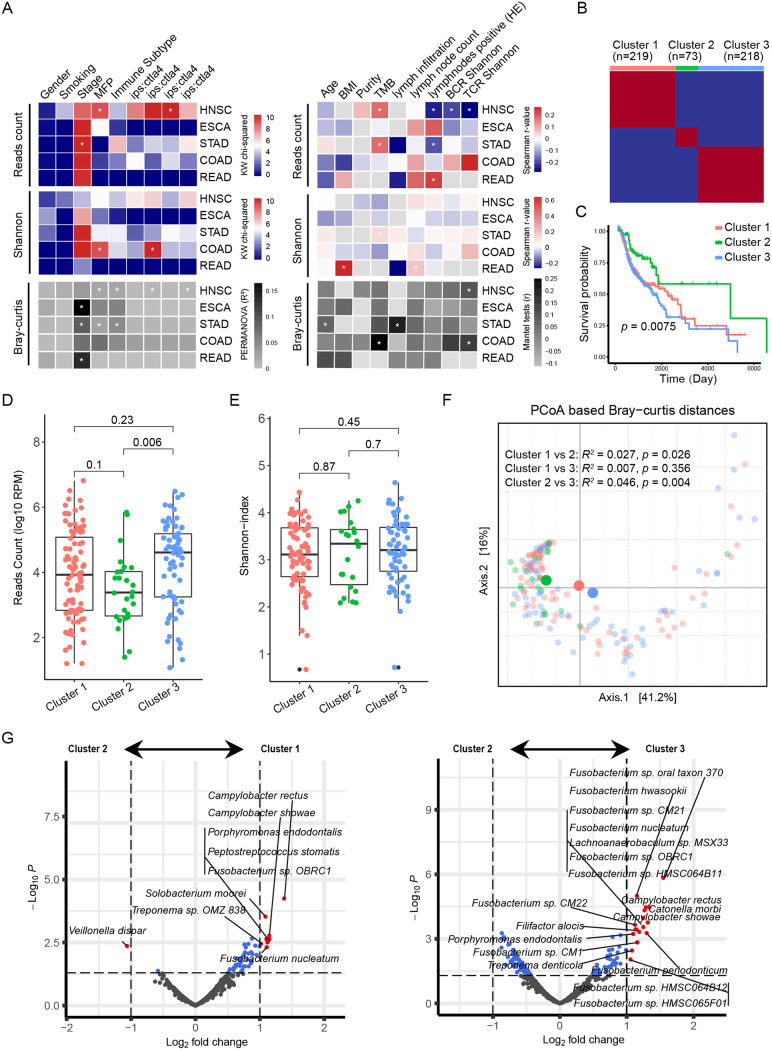
FIG 2.
Cluster classifications of immune characteristics distinguish prognosis in HNSC. (A) The heatmap on the left panel shows the chi-square values of the Kruskal-Wallis test in comparing the difference in bacterial counts (top) and alpha diversity (Shannon-index, middle) among patient discrete variables, and the R2 value for PERMANOVA in evaluating the difference in beta diversity (Bray-Curtis distance). The heatmap on the right shows the Spearman r value between continuous variables and bacterial reads or alpha diversity, as well as the Mantel test r value of beta diversity based on the variables. * indicates statistical significance (P < 0.05). (B) Based on TME signatures, HNSC patients were divided into three clusters by the NMF algorithm. (C) Kaplan-Meier curves of the three clusters. Significance was calculated using the log-rank test. (D and E) Differences in bacterial counts and alpha diversity among the three clusters. The comparison was performed with the Wilcoxon rank sum test. (F) PCoA was performed after calculating the Jaccard distance based on the CLR-transformed data, and the different colors in the scatterplot represent the three clusters. The significance of the microbial differences between the two groups was determined by PREMANOVA. (G) Volcano plot (based on the limma results) showing the differentially abundant bacteria between clusters 2 and 1 (left panel), as well as between clusters 2 and 3 (right panel).

