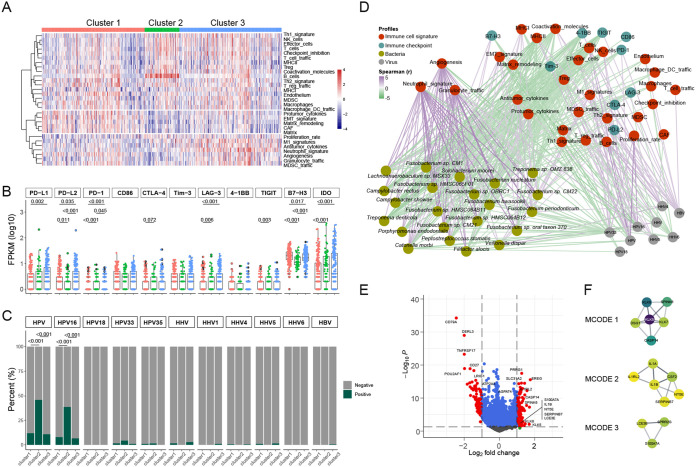
FIG 3.
Fusobacterium correlates with an inflammatory TME in HNSC. (A) Heatmap showing the clustering results based on TME signatures. (B) The differential expression of immune checkpoints among the three clusters. The comparison between two groups was performed with the Wilcoxon rank sum test. (C) Differences in virus signatures among the three clusters, with HPV and HHV being the sum of their respective subtypes. The comparison between two groups was performed with the chi-squared test. (D) The cross-domain interaction networks across TME signatures, immune checkpoints, virus abundance, and bacteria (differential species of cluster 2 compared with cluster 1 or cluster 3) were calculated by Spearman test. The interaction network was visualized with Cytoscape software. The colors of nodes in the network represent different domains, and the green and purple edges indicate significant negative or positive correlations between nodes, respectively. (E) Volcano plot (based on the limma results) showing the differentially expressed genes (DEGs) between clusters 2 and 3. (F) DEGs in cluster 3 were applied to construct PPI networks with Cytoscape software, and the three highly interactive modules were recommended by the MCODE algorithm.

