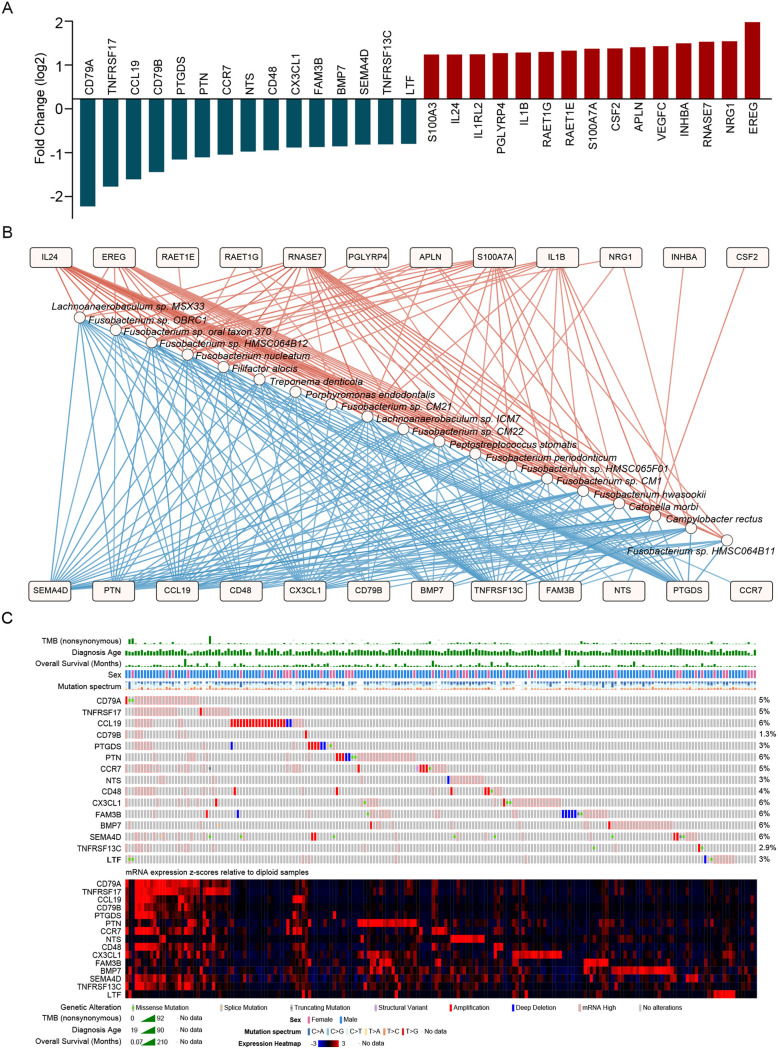
FIG 4.
Mutation landscapes of microbiota-associated inflammatory genes in HNSC. (A) The significantly downregulated (blue) and upregulated (red) immune-related genes (based on ImmPort Portal) in cluster 3 compared to cluster 2. (B) Spearman association network of significantly differentially abundant bacteria (circle nodes) and differentially abundant immune genes (square nodes) between clusters 2 and 3. The red and blue edges connecting nodes represent significant positive or negative correlations. Only nodes with significant interactions (P < 0.01, |r| > 0.3) were reported for this network. (C) The gene mutation and expression landscape of significantly downregulated immune-related genes in cluster 3 was analyzed in cBioPortal.

