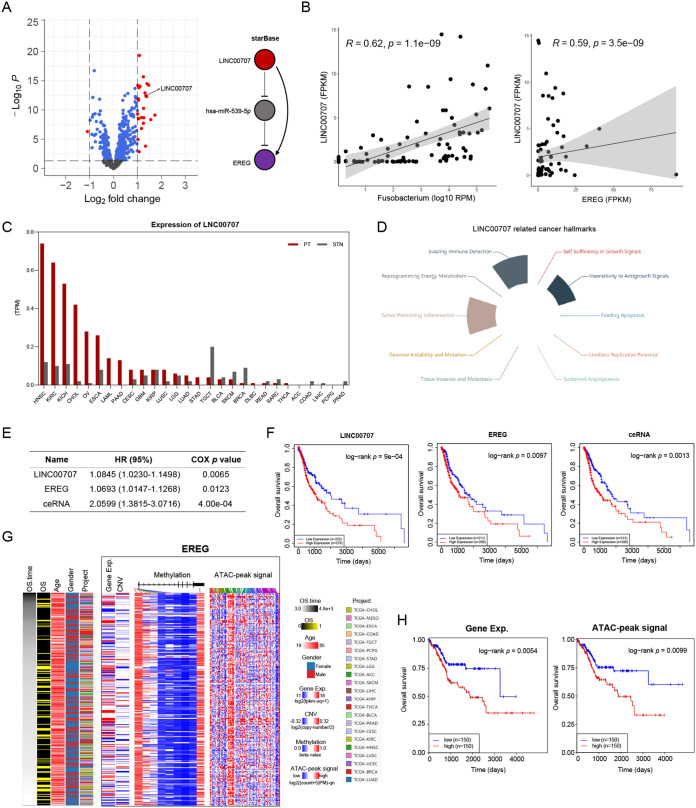
FIG 5.
Microbiota-associated inflammatory TME attributes to the ceRNA network and chromatin accessibility. (A) Volcano plot showing the differentially expressed lncRNAs between clusters 2 and 3 analyzed with the R package GDCRNATools. Calculations based on the R starBase database identified the lncRNA-mediated ceRNA pathway (LINC00707, hsa-miR-539-5P, EREG). (B) Spearman correlations between the LINC00707 expression and Fusobacterium counts or EREG expression. (C) The bar plot shows the LINC00707 expression profile across the tumor and normal tissues in the TCGA pan-cancer data set. (D) s The ceRNA-related cancer hallmarks were identified with the LnCeCell database. (E and F) Cox regression analysis and survival curves for the ceRNA were performed with LnCeCell. (G and H) The multi-omics landscape for the EREG gene was completed at UCSC Xena, and survival analysis was performed with the median as the cutoff point.

