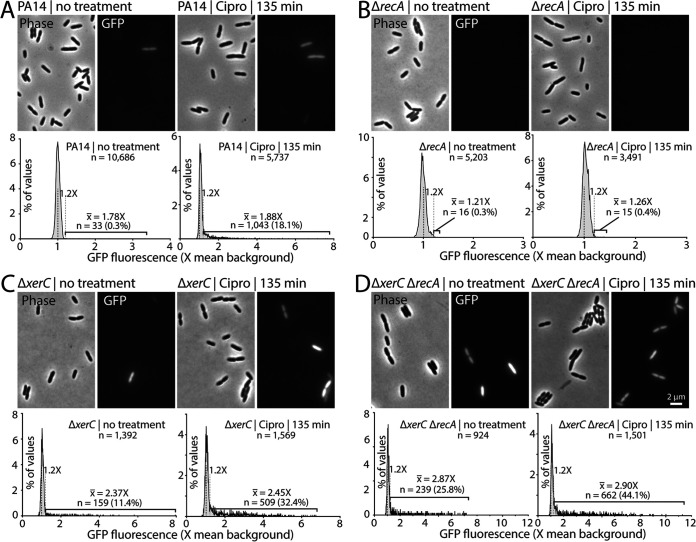
FIG 4.
Single-cell analysis of pyocin expression in ciprofloxacin-induced strains. Representative phase-contrast and GFP fluorescence (P07990-gfp) micrographs are shown in each panel above distributions of mean GFP fluorescence in individual cells of the indicated strains. As in our previous work, cells above a cutoff of 1.2× (gray dashed line) background fluorescence (black dashed line) were considered GFP positive. In each panel, untreated cells are compared to the same strain treated with 0.03 μg/mL ciprofloxacin for 135 min. All micrographs are sized and scaled identically. (A) PA14 (MTC2277). (B) ΔrecA strain (MTC2448). (C) ΔxerC strain (MTC2252). (D) ΔxerC ΔrecA strain (MTC2291). Percentages and average fluorescence (× background) of GFP-positive cells are indicated. A larger number of cells was analyzed in strains expected to have a lower proportion of GFP positivity to improve detection of rare GFP-positive cells.

