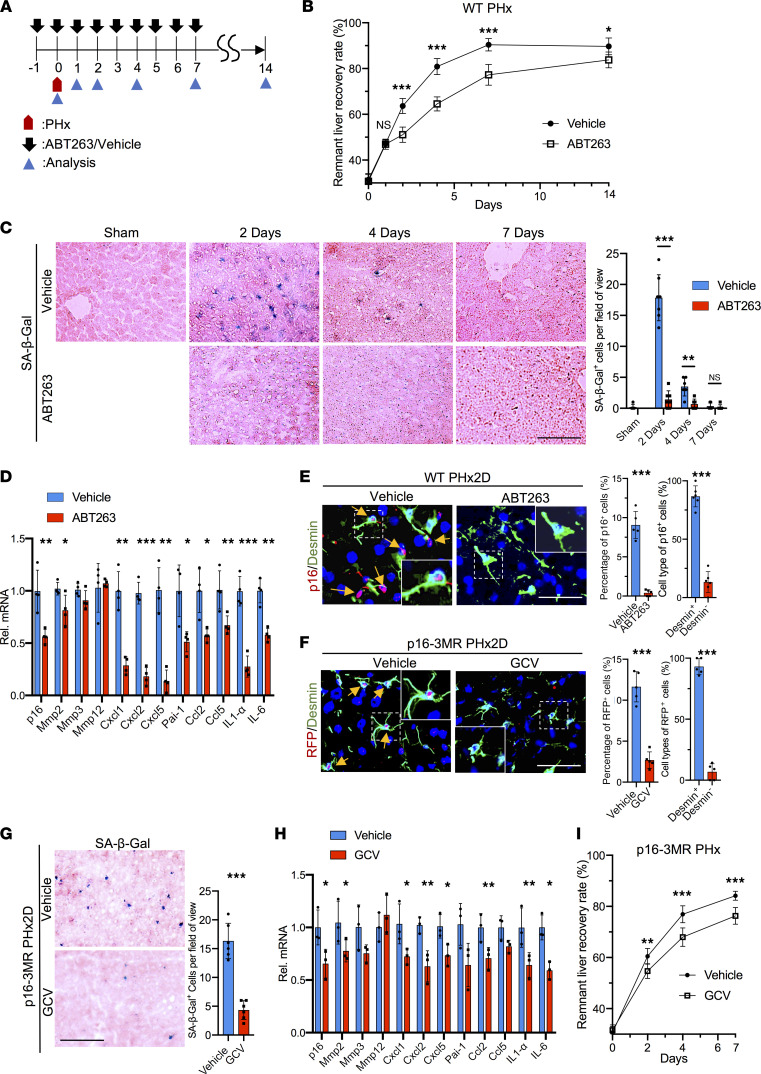
Figure 1. Elimination of senescent cells impairs liver regeneration.
(A) Scheme showing mice subjected to PHx and analyzed thereafter. ABT263 (100 mg/kg/d) or vehicle (DMSO) was injected daily 1 day before PHx for 15 days. (B) Remnant liver recovery rates are shown (n = 3 at days 0, 1, and 14; n = 8 day 2; n = 5 day 4; n = 4 day 7). (C) Frozen liver sections were stained for SA-β-Gal activity (blue) and counterstained with eosin (pink). SA-β-Gal+ cells per microscopic field were quantified (sham n = 3; day 2, n = 7; days 4 and 7, n = 6). (D) Liver expression of the SASP 2 days post-PHx was quantified by quantitative reverse transcription PCR (qRT-PCR) (n = 4). (E) Liver sections from vehicle- or ABT263-treated WT mice 2 days post-PHx (PHx2D) were immunostained for p16 (red) and desmin (green) and counterstained with DAPI (blue). Arrows point to p16+ cells (n = 5). Percentage of p16+ cells that were desmin+ or desmin– was quantified by cell counting (n = 6). (F) p16-3MR mice were treated daily with GCV or vehicle (PBS) after PHx. Liver sections 2 days post-PHx were immunostained for RFP (red) and desmin (green) and counterstained with DAPI (blue). Arrows point to RFP+ cells, quantified by cell counting (n = 5). (G) The frozen liver sections were stained for SA-β-Gal activity (blue) and counterstained with eosin (pink). SA-β-Gal+ cells (n = 6) were counted. (H) Expression of p16 and genes of the SASP in the liver 2 days post-PHx was quantified by quantitative PCR (n = 3). (I) The remnant liver recovery rates of vehicle- and GCV-treated p16-3MR mice after PHx (n = 3 day 0, n = 6 day 2, n = 4 days 4 and 7; P < 0.033 by 2-way ANOVA for comparison of the remnant liver recovery curves). Scale bars: 50 μm. Data expressed as mean ± SD. *P < 0.033, **P < 0.002, ***P < 0.001 by Student’s t test (C–H) or 2-way ANOVA (B and I).

