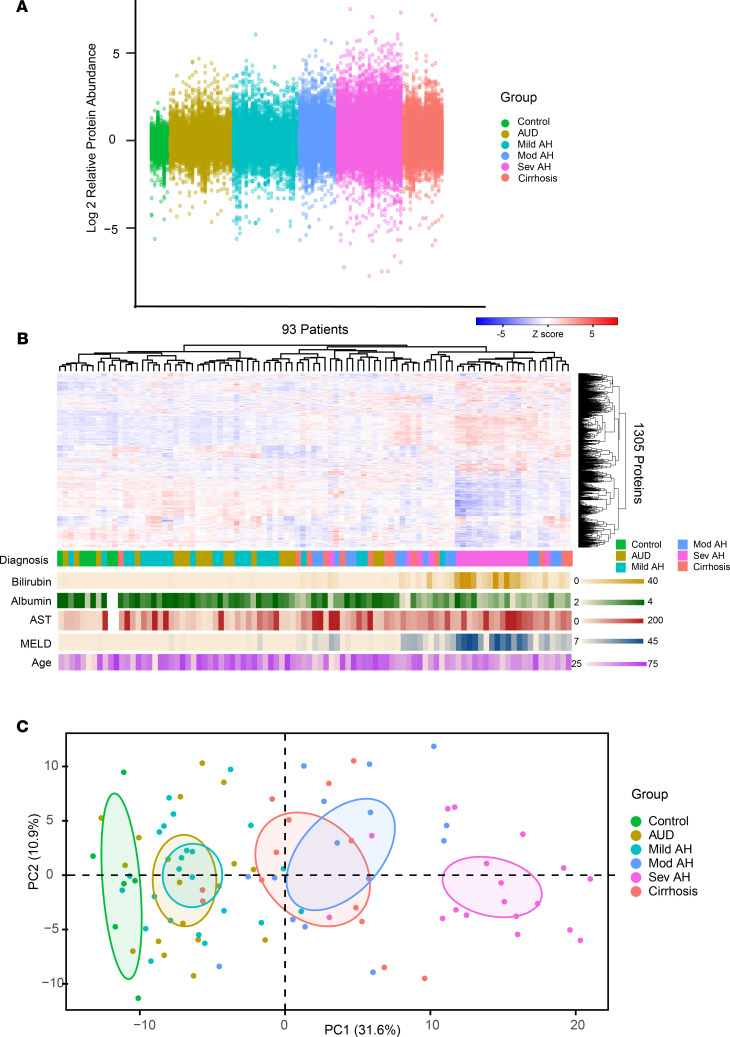
Figure 1. The proteomic signature of ALD.
(A) Relative log2 fold abundance of each of 1305 proteins for each patient (n = 93) by clinical diagnosis. (B) Cluster dendrogram of patients versus relative protein abundance with clinical diagnosis and clinical characteristics. (C) PCA of relative protein abundance grouped by clinical diagnosis.

