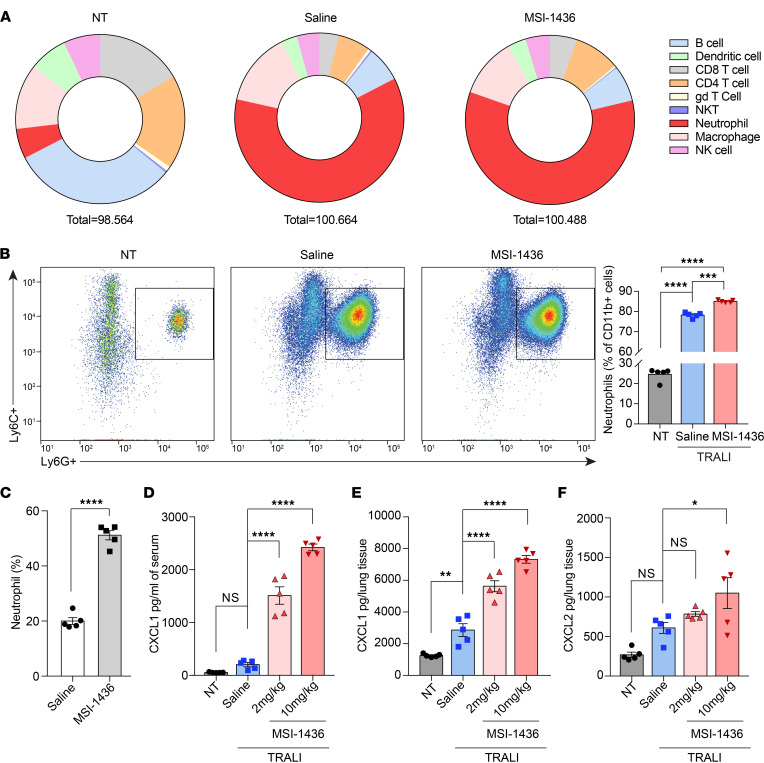
Figure 2. Treatment with PTP1B inhibitors in vivo induced neutrophilia.
(A) Pie charts of flow cytometry analysis to measure infiltration of 9 immune cell populations into lung tissues. The numbers are average abundance of each immune cell subset (% of CD45+ cells, n = 5). For saline- and MSI-1436–treated (10 mg/kg) groups, the lungs were harvested 30 minutes after TRALI induction. (B) Representative flow cytometry plots for neutrophils infiltrated into lung tissues. Quantification of percentage of neutrophil population out of myeloid cells. (C) Percentage of neutrophils (relative to total WBCs) in peripheral blood from mice treated with saline or 10 mg/kg MSI-1436 for 2.5 hours (n = 5). (D and E) CXCL1 levels in serum (D) and matched lung tissue (E) from NT and TRALI mice treated with saline or MSI-1436 at the indicated doses (n = 5). (F) CXCL2 levels in lung tissue from NT and TRALI mice treated with saline or MSI-1436 at the indicated doses (n = 5). Data are presented as mean ± SEM. Statistical analysis for C was performed by 2-tailed Student’s t test and by 1-way ANOVA with Tukey’s multiple-comparison test for B and D–F. *P < 0.05, **P < 0.01, ***P < 0.001, ****P < 0.0001.

