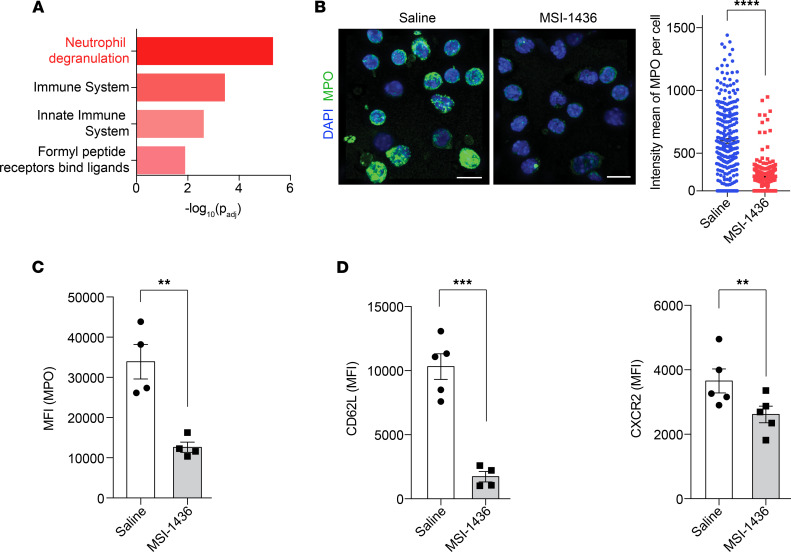
Figure 3. Treatment with MSI-1436 in vivo induced an aged-neutrophil phenotype.
(A) Reactome pathway analysis performed using g:Profiler for genes upregulated upon MSI-1436 treatment. (B) Representative confocal immunofluorescence microscopy images and quantification of neutrophils isolated from peripheral blood 2.5 hours after injection of saline or MSI-1436, and stained with anti-MPO (green) and DAPI (blue). Scale bars: 10 μm, n = 4 mice per group. (C) Neutrophils stained for MPO-containing granules from mice treated with saline or MSI-1436 for 2.5 hours. MPO signals were quantified as mean fluorescence intensity (MFI) (n = 4). (D) Surface expression of CD62L and CXCR2 on neutrophils from peripheral blood collected 2.5 hours after saline or MSI-1436 treatment, quantified as MFI (n = 5). Data are presented as mean ± SEM. Statistical analysis for B–D by 2-tailed Student’s t test. **P < 0.01, ***P < 0.001, ****P < 0.0001.

