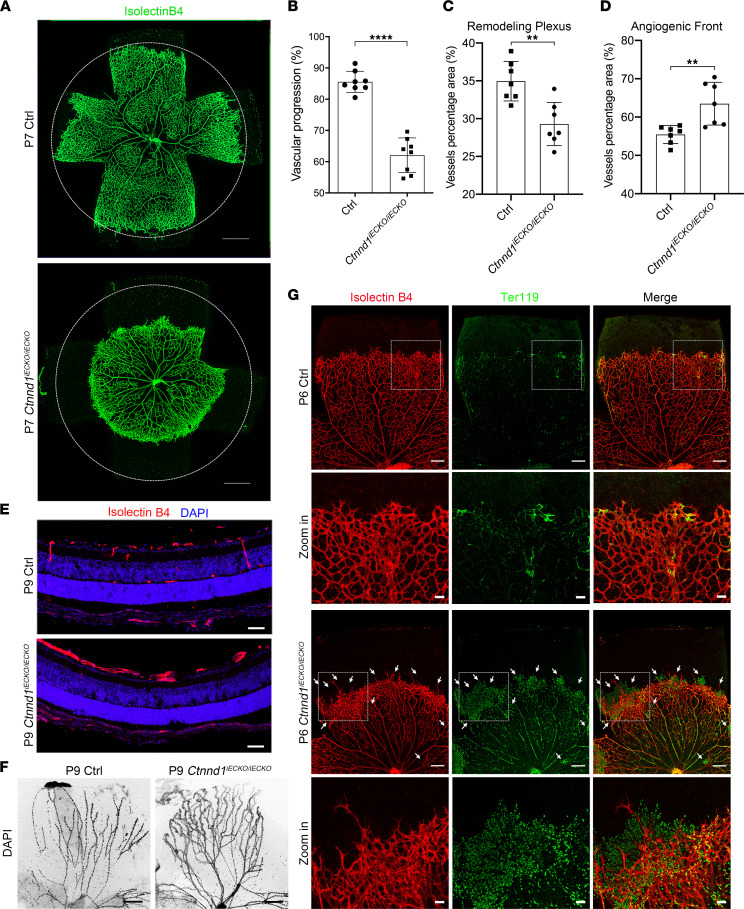
Figure 3. Loss of Ctnnd1 in mouse ECs impairs angiogenesis and hyaloid regression.
(A) Representative overview of P7 control (Ctrl) and Ctnnd1iECKO/iECKO mouse retinas labeled with isolectin B4 (IB4). The circles indicate vessel outgrowth in the Ctrl group. Scale bars, 500 μm. (B–D) Quantification of vascular progression (B), vascular density in the remodeling plexus (C), and angiogenic front (D) of P6 Ctrl and Ctnnd1iECKO/iECKO mouse retinas. Error bars, standard deviations (SDs). Student’s t test (n ≥ 7), **P < 0.01, ****P < 0.0001. (E) Representative immunofluorescence images of cross sections of retinas from P9 Ctrl and Ctnnd1iECKO/iECKO mice costained with IB4 (red) and DAPI (blue). Scale bars, 20 μm. (F) Representative immunofluorescence images of hyaloid vessels from P9 Ctrl and Ctnnd1iECKO/iECKO mice. Scale bars, 200 μm. (G) Representative overview and high-magnification immunofluorescence images of P6 Ctrl and Ctnnd1iECKO/iECKO mouse retinas labeled with IB4 (red) and Ter119 (green). Dotted boxes indicate magnified areas. White arrows indicate abnormal leakage of erythrocytes. Scale bars, 200 μm and 50 μm. Experiments were performed at least 3 times independently.

