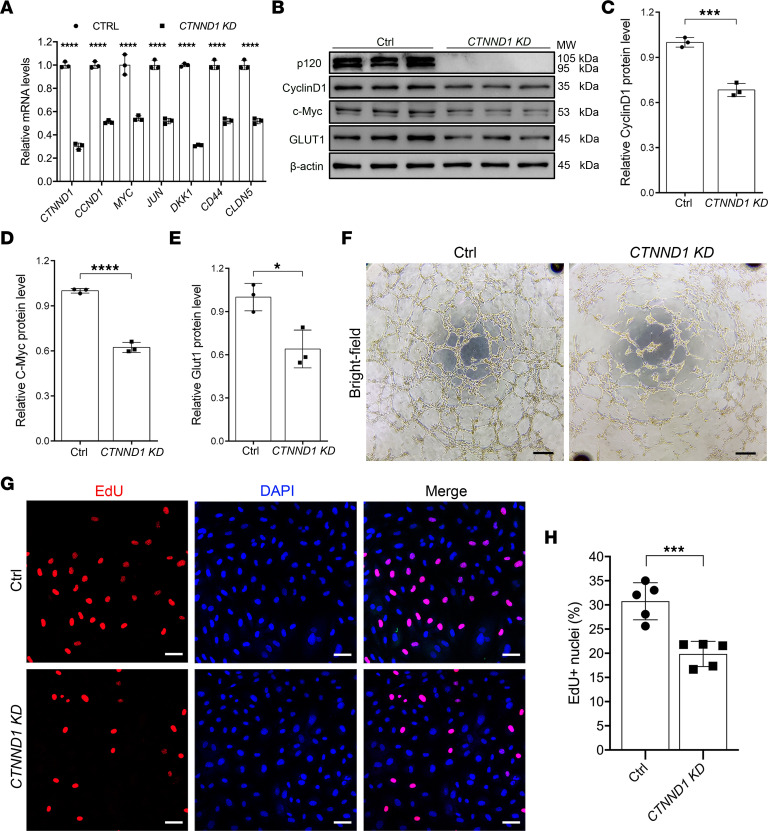
Figure 7. Depletion of CTNND1 in HRECs inhibits in vitro EC angiogenesis and cell proliferation partially through inactivation of Wnt signaling activity.
(A) Quantification of relative CTNND1, CCND1, MYC, JUN, DKK1, CD44, and CLDN5 mRNA levels detected by RT-qPCR in Ctrl and CTNND1-KD HRECs. Error bars, SDs. Student’s t test (n = 3), ****P < 0.0001. (B) Western blot analysis of protein levels of Wnt signaling targets (p120, CyclinD1, c-Myc, and GLUT1) in Ctrl and CTNND1-KD HRECs. (C–E) Quantification of relative CyclinD1, c-Myc, and GLUT1 protein levels in Ctrl and CTNND1-KD HRECs. Error bars, SDs. Student’s t test (n = 3), *P < 0.05, ***P < 0.001, ****P < 0.0001. (F) Representative bright-field images of in vitro tube formation in Ctrl and CTNND1-KD HRECs. Scale bars, 25 μm. (G) Representative immunofluorescence images of Ctrl and CTNND1-KD HRECs labeled with EdU (red) and DAPI (blue). Scale bars, 50 μm. (H) Quantification of the percentage of EdU+ nuclei in Ctrl and CTNND1-KD HRECs. Error bars, SDs. Student’s t test (n = 5), ***P < 0.001. Experiments were performed at least 3 times independently.

