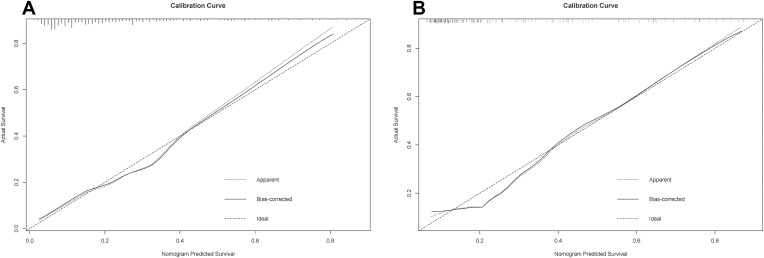
Figure 3.
Calibration curves for the purpose of developing a nomogram for predicting the overall risk of post-hepatectomy liver failure in (A) training cohort and (B) validation cohort. The dashed line depicts the ideal curve that would exist if the expected result and the actual circumstance were identical. If the anticipated occurrence rate of the calibration curve is closer to the dashed line than the measured occurrence rate, the model’s prediction ability is more accurate. The x-axis depicts the expected incidence of post-hepatectomy liver failure for this nomogram, whereas the y-axis depicts the actual incidence of PHLF.

