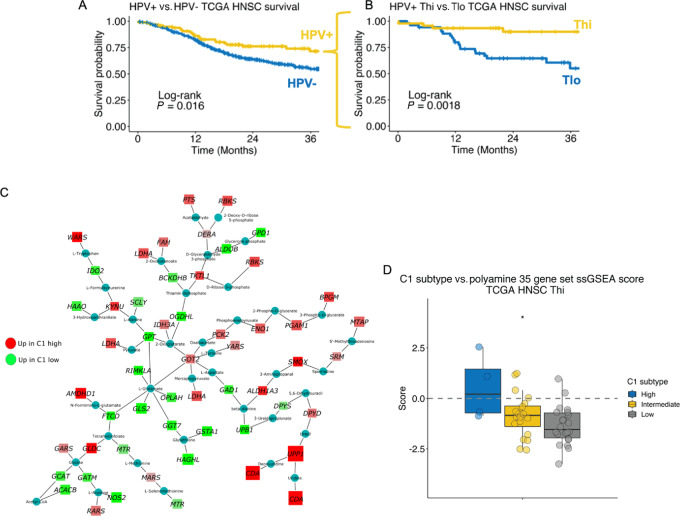
FIGURE 1.
PA metabolism genes are differentially expressed between T cell–infiltrated HPV-related (HPV+) HNSCs stratified by a prognostic molecular gene signature. A, Survival among TCGA HNSC stratified by HPV status [HPV+, n = 97; HPV− (carcinogen-driven), n = 421]. B, HPV+ HNSC tumors were stratified by T-cell infiltration as inferred by ssGSEA CD8+ T-cell and cytotoxic lymphocyte gene set scores. Survival based on T-cell infiltration status is shown. C, Metabolic gene transcriptional network analysis comparing TCGA HPV+ Thi HNSCs based on the high-risk HPV+ HNSC C1 gene set DE results (C1 high vs. C1 low). Red nodes, gene expression enriched in C1 high tumors. Green nodes, gene expression enriched in C1 low HPV+ HNSCs. D, ssGSEA scores from a curated set of 35 genes involved in PA metabolism among TCGA HPV+ Thi HNSCs stratified by C1 gene set expression strata divided into high, intermediate, and low. *, P ≤ 0.05.

