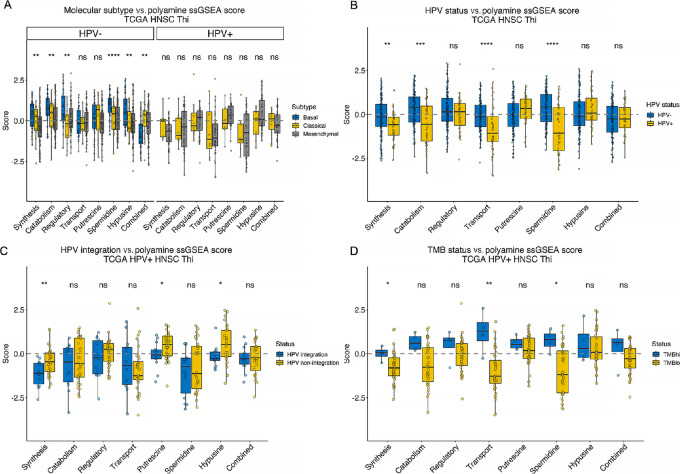
FIGURE 3.
PA metabolism gene set expression and tumor-intrinsic features. PA gene set expression was quantitated using ssGSEA. PA metabolism genes were grouped into synthesis, catabolism, regulatory, transport, putrescine biosynthesis, spermidine biosynthesis, hypusine biosynthesis, and combined gene sets. PA ssGSEA scores across TCGA Thi HNSCs were stratified by molecular subtype (A), HPV status (B), HPV integration status (C), and TMB (TMBhi, ≥10 mutations/Mbp; TMBlo, <10 mutations/Mbp; D). *, P ≤ 0.05; **, P ≤ 0.01; ***, P ≤ 0.001; ****, P ≤ 0.0001; ns, P > 0.05.

