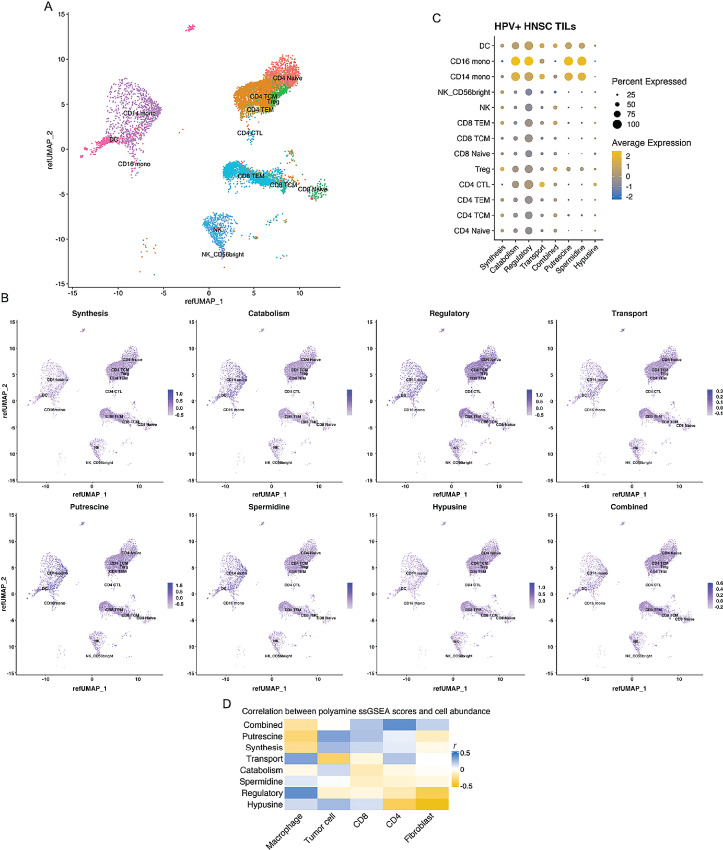
FIGURE 4.
PA pathway expression and TILs in HPV+ HNSC. Publicly available TIL scRNA-seq data from eight HPV+ HNSCs (14,859 cells) were mapped onto a reference single-cell dataset to infer cell lineage. A, Uniform Manifold Approximation and Projection (UMAP) demonstrating lineage assignments across HPV+ HNSC TILs. B, PA metabolism pathway expression overlaid onto UMAP demonstrating pathway expression among clusters and quantified in C. D, CIBERSORT was used to infer cellular abundance for stromal cells in the TME using TCGA HPV+ Thi HNSCs. Cellular abundances were correlated with PA pathway ssGSEA scores and Pearson correlation coefficients (r) represented in the heatmap.

