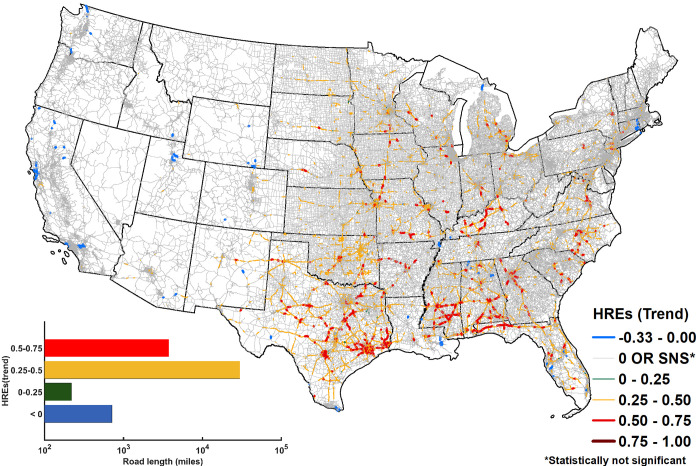
Fig 2. Trends in annual frequency of HREs during 1980–2017.
Over ~34,602 miles of road sections (~5.5% of overall road sections within CONUS) experience statistically significant trend (p < 0.05) in annual frequency of HREs. Out of these, 97% of road sections (~33,669 miles) experience moderate to high (0.25–0.75) rate of increase (inset plot). 63% (~21,292 miles) of road sections with statistically significant moderate to high trend reside within the southern United States. 714 miles of road sections (0.12% of roads experiencing HREs) exhibit a negative trend in HREs.

