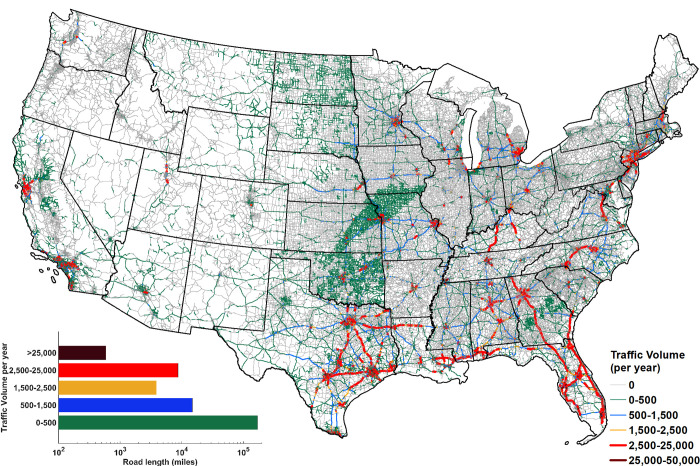
Fig 3. Estimated annual average traffic volume subjected to HpR during 1980–2017.
Traffic volume is evaluated over ~198,000 miles or ~98 percent of road sections within CONUS experiencing any HRE. 78% of these road sections constituting 169,981 miles have an annual average traffic volume within 0–500 (inset plot). 58% of the road sections with annual average traffic volume > 2,500 are located within the southern CONUS.

