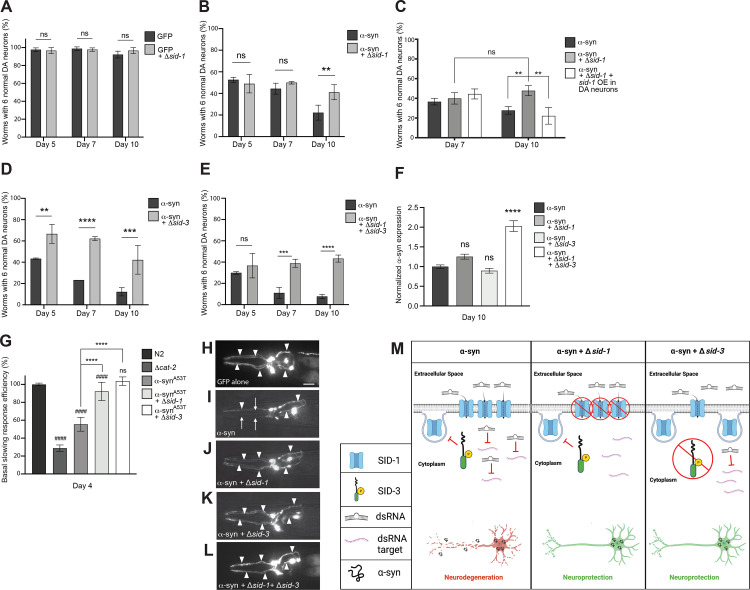
Fig 1. Loss of SID-1 and/or SID-3 functionality decreases DA neurodegeneration and improves DA neuron function.
(A-E) DA neurons were scored for degeneration on days post-hatching indicated on X axes. Values represent mean + S.D. (n = 30 worms per genotype per replicate, 3 independent replicates per experiment). Two-Way ANOVAs with Šídák’s post hoc analyses were used for comparisons of transgenic animals at each time point (A, B, D, E) while a Tukey’s post hoc analysis was used to compare all conditions to each other in panel C; ns P ≥ 0.05, ** P < 0.01, *** P <0.001, **** P < 0.0001. (F) Expression levels of α-syn in α-syn only worms and α-syn worms with sid mutations. Expression is normalized to the α-syn only group. Total RNA was isolated at day 10 post-hatching. One-Way ANOVA with Dunnett’s post hoc analysis was used to compare α-syn alone to α-syn + sid-1(pk3321), α-syn + sid-3(ok973), and α-syn + sid-1(pk3321) + sid-3(ok973); ns P ≥ 0.05, **** P < 0.0001. (G) Basal Slowing Response Efficiency assay, normalized to N2. cat-2 mutants synthesize significantly less DA than N2 worms and serve as a positive control. Transgenic worms expressing a familial mutant of α-syn, without GFP in the neurons, Pdat-1:: α-synA53T, along with sid-1(pk3321) and sid-3(ok973) mutant backgrounds, were used in this assay to quantify early changes in neurotransmission. Worms were tested on day 4 post-hatching. One-Way ANOVA with Tukey’s post hoc analysis was used to compare all conditions to each other. Symbols above bars are in comparison to N2 control; ns P ≥ 0.05, #### P < 0.0001. Symbols above brackets are in comparison to bars indicated. **** P < 0.0001. (H-L) These images represent the six anterior DA neurons in characteristic worms expressing GFP in the six head neurons on day 10 post-hatching. Arrowheads indicate intact DA neurons while arrows indicate degenerated DA neurons. Scale bar, 20 μm. (H) This animal expresses GFP only and displays a full complement of 6 anterior DA neurons. (I) GFP + α-syn expressed in DA neurons where the arrowheads indicate only 3 neurons are intact while 3 neurons are degenerating (arrows). (J) GFP + α-syn expressed in DA neurons in a sid-1(pk3321) mutant background; all 6 anterior DA neurons are intact. (K) GFP + α-syn expressed in DA neurons in a sid-3(ok973) mutant background; all 6 anterior DA neurons are intact. (L) GFP + α-syn expressed in a sid-1(pk3321); sid-3(ok973) double mutant background; all 6 anterior DA neurons are intact. (M) A tripartite illustration (created with Biorender.com) depicting an interpretation of the results obtained where the activity of SID-1 and/or SID-3 modulates dsRNA import, leading to differential effects on α-syn-induced DA neurodegeneration. The left pane displays a scenario where α-syn is expressed in DA neurons, while sid-1 and sid-3 are both wildtype: activated SID-3 functions as an endocytic brake, thereby preventing endocytosis of SID-1, which maintains the transport of dsRNAs that silence target genes in DA neurons, rendering them vulnerable to neurodegeneration. The middle pane displays the situation when α-syn is expressed in DA neurons of animals in which sid-1 is mutant and sid-3 is wildtype: here, the loss of SID-1 function results in reduced dsRNA transport, thereby leading to the neuroprotection from α-syn overexpression observed, as a logical consequence of attenuated gene silencing and the concomitant transcriptional upregulation of protective gene products. In the right pane, sid-1 is wildtype and sid-3 is mutant in the same neurotoxic α-syn background: when SID-3 is incapacitated by mutation the endocytosis of SID-1 is no longer blocked, resulting in diminished dsRNA import and a reduction in the silencing of neuronal target gene expression that leads to the enhanced neuroprotection observed experimentally.

