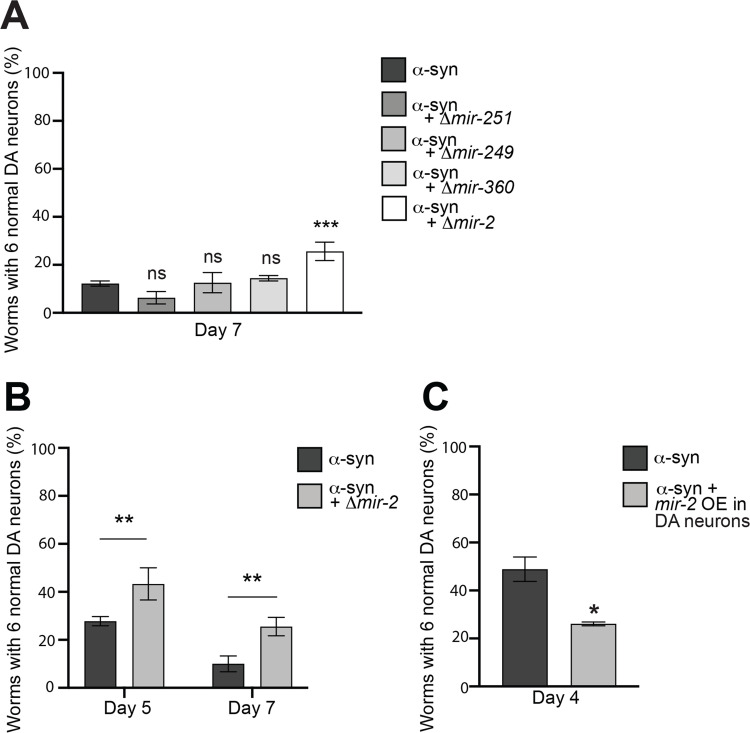
Fig 3. Modulation of α-syn-induced DA neurodegeneration by mir-2.
(A) DA neurons were scored for degeneration on day 7 post-hatching. Values represent mean + S.D. (n = 30 worms per genotype per replicate, 3 independent replicates). One-Way ANOVA with Dunnett’s post hoc analysis was used to compare α-syn alone to α-syn crossed with Δmir-251(n4606), Δmir-249(n4983), Δmir-360(n4635), or Δmir-2 (gk259); ns P ≥ 0.05, *** P < 0.001. (B) DA neurons were scored for degeneration on days 5 and 7 post-hatching. Values represent mean + S.D. (n = 30 worms per genotype per replicate, 3 independent replicates). Two-Way ANOVA with Šídák’s post hoc analysis was used to compare α-syn alone to α-syn + Δmir-2(gk259) at each time point; ** P < 0.01. (C) DA neurons were scored for degeneration on day 4 post-hatching. Values represent mean + S.D. (n = 30 worms per genotype per replicate, 3 independent replicates of 2 independent stable lines). Unpaired, two-tailed Student’s t-test was used to compare α-syn with mir-2 overexpression (OE) in DA neurons (Pdat-1::mir-2) to α-syn only controls; * P < 0.05.

