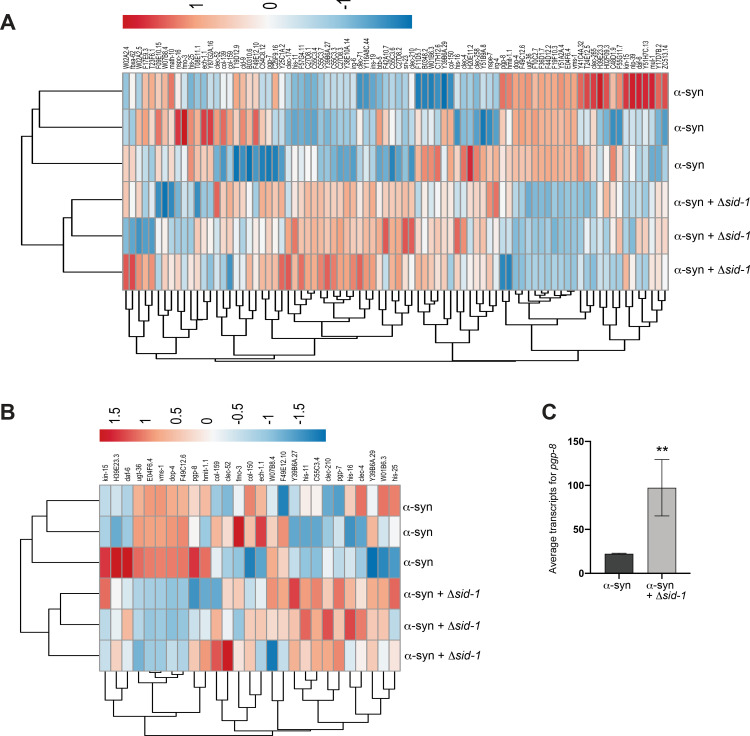
Fig 6. Transcriptomic analysis reveals DEGs between α-syn and α-syn + Δsid-1 worms.
(A, B) Heatmaps depicting regulatory status of the DEGs (columns) from the transcriptomic analysis comparing α-syn and α-syn + Δsid-1 groups (rows). Both the α-syn and α-syn + Δsid-1 groups constitute 3 replicates each. RNA was isolated at day 6 post-hatching. (A) Heatmap of all 84 DEGs associated with this analysis; (B) depicts the regulatory status of the 27 DEGs with human orthologs. (C) pgp-8 mRNA transcript levels in the α-syn background alone and the α-syn background with the sid-1 mutation, identified from the transcriptomic analysis between the α-syn and α-syn + Δsid-1 groups. Both groups constitute 3 replicates each. The DESeq2 program with the Benjamini-Hochberg method was used to obtain adjusted p-values (Novogene Corporation, Inc.); ** P(adjusted) < 0.01.

