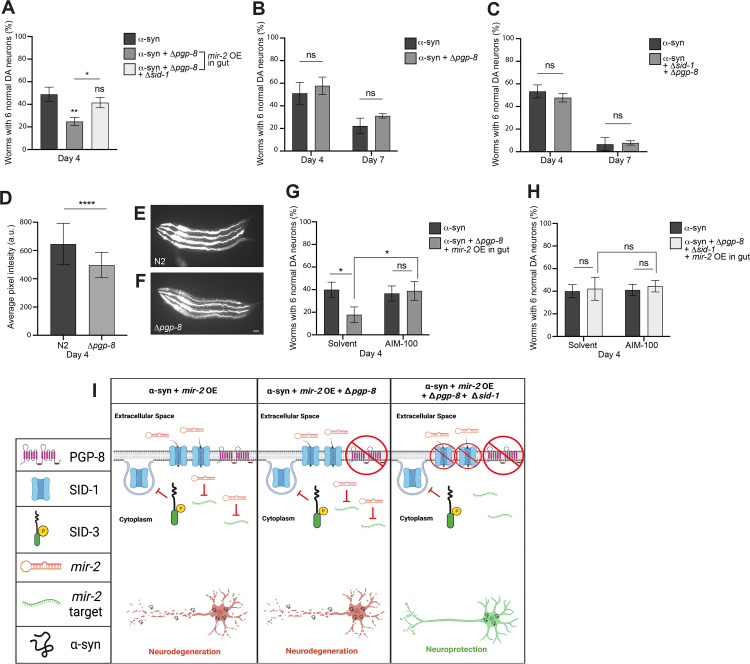
Fig 7. Loss of both SID-1 and PGP-8 functionality reduces mir-2 OE-induced enhancement of neurodegeneration.
(A) DA neurons were scored for neurodegeneration at day 4 post-hatching in an α-syn model background with mir-2 OE in the intestine (Pges-1::mir-2), with a Δpgp-8(ok2489) mutant and Δpgp-8(ok2489); Δsid-1(pk3321) double mutant. Values represent mean + S.D. (n = 30 worms per genotype/group per replicate, 3 replicates of 3 independent stable lines). One-Way ANOVA with Tukey’s post hoc analysis was used to compare all conditions to each other. Symbols above bars are in comparison to α-syn only controls while the straight line is a comparison of the bars indicated; ns P ≥ 0.05, * P < 0.05, ** P < 0.01. (B, C) α-syn control worms with pgp-8(ok2489) (B) or pgp-8(ok2489); sid-1(pk3321) (C) were analyzed for DA neurodegeneration at days 4 and 7 post-hatching. Values represent mean + S.D. (n = 30 worms per genotype per replicate, 3 independent replicates). Two-Way ANOVA with Šídák’s post hoc analysis was used to compare α-syn alone with the mutant displayed in the same graph; ns P ≥ 0.05. (D-F) N2 wildtype and pgp-8(ok2489) mutant worms following a 48-hour exposure to 10 μM of rhodamine 123. (D) Average pixel intensity was measured 48 hours post-hatching. Values represent mean + S.D. (n = 30 worms per genotype per replicate, 3 independent replicates). Unpaired, two-tailed Student’s t-test was used to compare N2 to pgp-8(ok2489); **** P < 0.0001. Representative images of N2 (E) and pgp-8 mutant (F) C. elegans (4 worms per panel, anterior to left) exhibiting fluorescence due to rhodamine 123 treatment. Scale bar, 50 μm. (G, H) DA neurodegeneration at day 4 post-hatching. Values represent mean + S.D. (n = 30 worms per genotype/group per replicate, 3 independent replicates of 1 independent stable line). α-syn control worms or the α-syn with mir-2 OE in the intestine (Pges-1::mir-2) with pgp-8(ok2489) (G) or pgp-8(ok2489); sid-1(pk3321) (H) were either exposed to the 0.1% ethanol solvent control or AIM-100 (100 μM). Two-way ANOVA with Tukey’s post hoc analysis was used to compare all conditions to each other; ns P ≥ 0.05, * P < 0.05. (I) An triptych illustration (created with Biorender.com) reflecting an interpretation of the experimentally observed impact on α-syn-induced DA neurodegeneration caused by intestinal overexpression of mir-2 in either a pgp-8 knockout mutant or a pgp-8; sid-1 double mutant. In the left pane, SID-3 blocks the endocytosis of SID-1 on cell membranes, maintaining ample SID-1 on cell surfaces to transport mir-2 into cells, allowing for mir-2 target gene silencing and leading to enhanced neurodegeneration. The middle pane displays the situation when α-syn is expressed in DA neurons and mir-2 is OE in the intestine, while sid-1 is wildtype and pgp-8 is mutant. In this model, SID-3 blocks the endocytosis of SID-1 on the plasma membrane, resulting in the transport of mir-2 for target gene silencing and the enhanced neurodegeneration observed experimentally. It is presumed that a loss of PGP-8 function does not influence mir-2 import into cells, since SID-1 remains functional. The right pane is a model for when both sid-1 and pgp-8 are mutant in animals expressing α-syn in the DA neurons, with mir-2 being overexpressed in the intestine. Here we hypothesize that mir-2 might not be imported into cells either due to a mutation that renders SID-1 non-functional, or by the enigmatic process by which PGP-8 may influence mir-2 import into cells, also associated with a mutation rendering it non-functional. In either case, less or no mir-2 import into cells results, and instead, leads to an infusion of target gene transcription that contributes to the observed neuroprotection.

