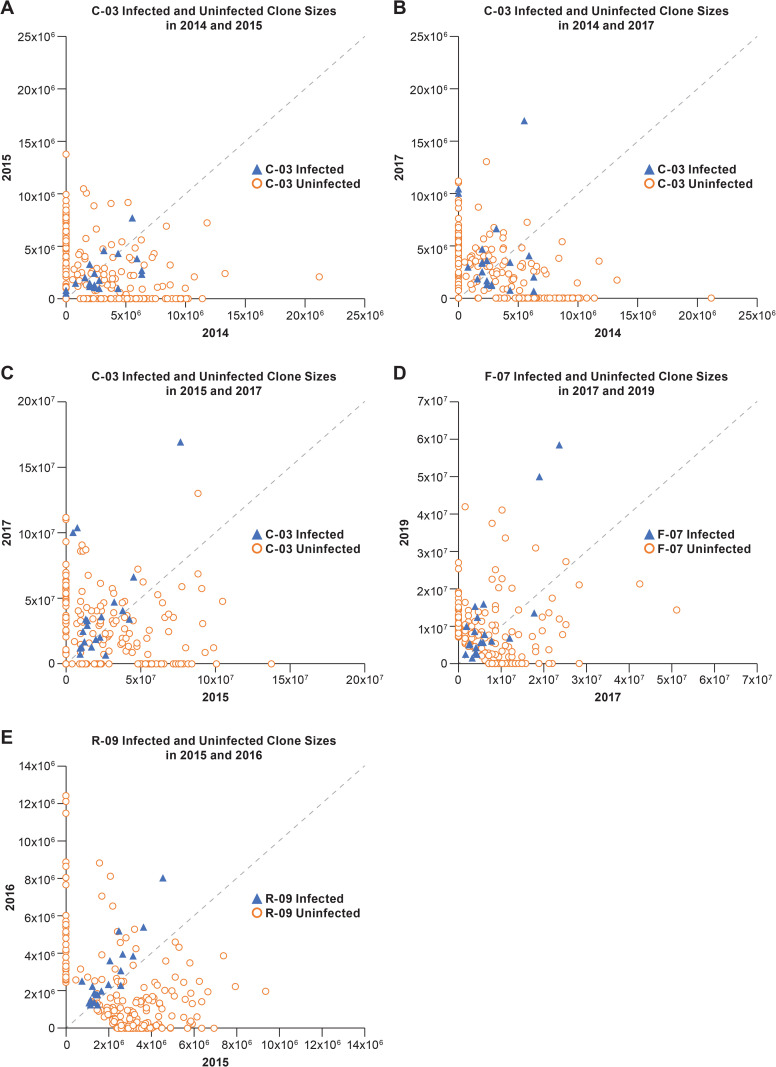
Fig 2. Scatter plots showing the stabilities of clones of infected and uninfected CD4+ T cells.
Each panel shows the sizes of the 20 largest clones of infected T cells (blue triangles) and the sizes of 200 clones of uninfected T cells of a similar size at two different times. The dotted line is the diagonal. Any clone whose size does not change between the time points shown on the axes would fall on this diagonal. Similarly, the change in the sizes of each of the clones can be measured by the distance from the diagonal. Each panel (A-E) shows a comparison for two time points; the donors and the times are noted in each of the panels.

