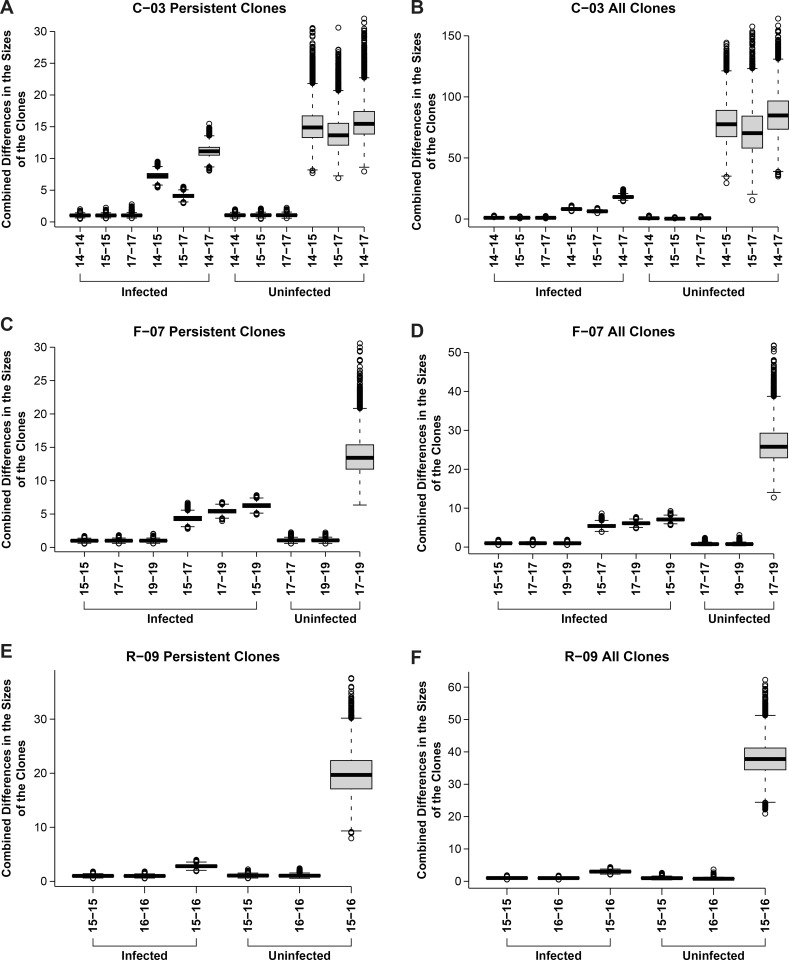
Fig 3. Overall stabilities of clones of infected and uninfected T cells.
For each pair of time points for each donor, we determined the differences in the sizes of the each of clones in the dataset. For the comparisons of the differences in the sizes of the clones of infected cells, the 100 largest clones were used and the sizes of the clones were determined as described in the S1 Text. For the uninfected cells, a dataset of clones of a similar size was compiled, and the stability calculations were done using randomly sampled groups of 100 uninfected clones. The uncertainties in the measured sizes of the clones in each of the datasets was determined by doing a within dataset comparisons which are shown in the figure as comparisons for the same time points. The uncertainties within each of the datasets and between the datasets are shown both as a box plot (which shows the standard deviation) and as the 95% confidence limits (marked by horizontal lines separated by a dashed vertical line). The mean is the bar in the middle of the box plots. Any data from the 10,000 runs that falls outside the 95% confidence limits are shown as open circles. The method of calculating the uncertainties is described in the S1 Text. The size differences were combined to obtain a measure of the overall differences in the sizes of the group of clones for the time points being compared. The overall measure of the combined differences in the sizes of the clones, given on the Y axis, provide a good measure of the overall differences in the sizes of the clones, but the numbers on the Y axis do represent a simple metric.

