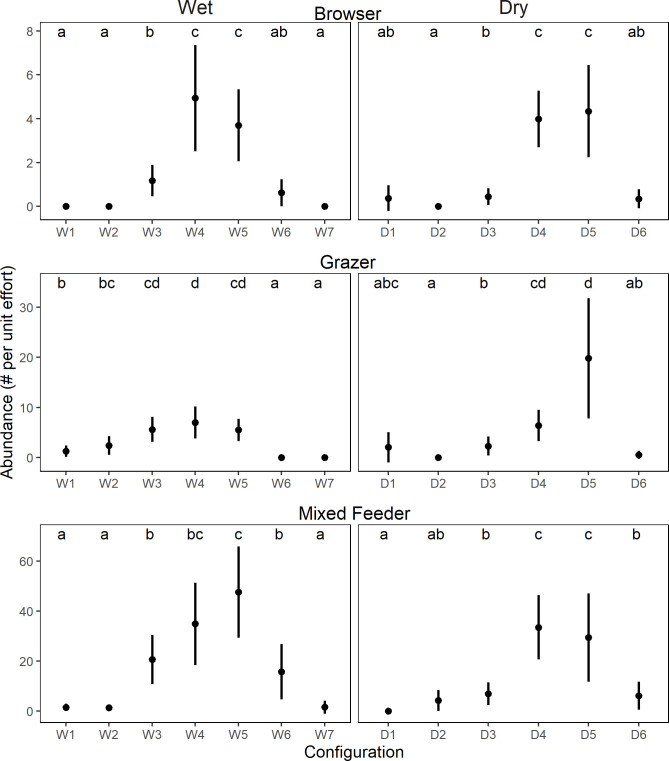
Fig 3. Species abundance (mean ± 95% CI) across configurations in the wet and dry seasons for each of the three feeding guilds.
Configurations are organized by increasing woody plant cover (see Figs 1 and 2). Tukey’s honest significant difference tests reveal significant differences in abundance among the different configurations, as denoted by the lowercase letters within the data space.

