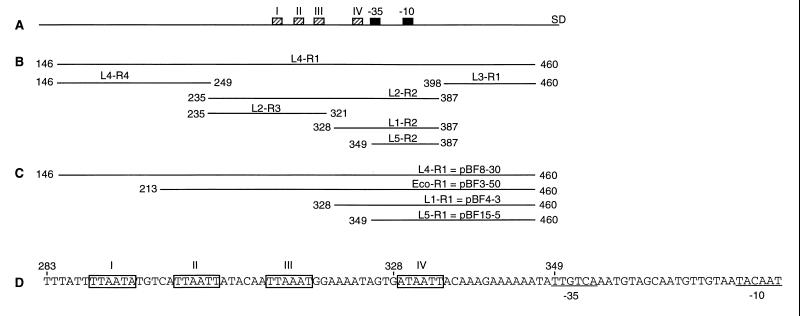
FIG. 1.
Maps of the different DNA segments of the norA promoter examined in this study. The numbers indicate the nucleotide positions according to Yoshida et al. (38). (A) Schematic map of the norA promoter. The −35 and −10 consensus sequences are indicated by black boxes, and the Shine-Dalgarno site is marked SD. The repeated sequences, shown in panel D, are indicated by hatched boxes. (B) PCR fragments used in band shift experiments. (C) Schematic map showing the DNA cloned upstream of the β-lactamase gene in transcriptional fusions. (D) Sequence of the region upstream of the −35 consensus sequence. Repeated sequences are boxed, and the −35 and −10 sequences are underlined.

